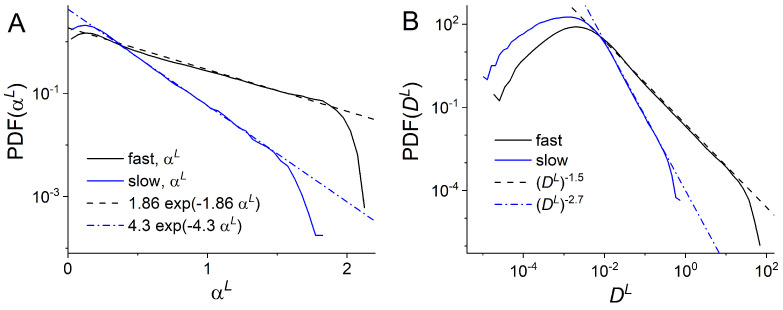
Figure 5.
Distribution of local anomalous exponents (A) and local generalized diffusion coefficients (B) obtained from experimental trajectories of slow and fast endosomes. The dashed and dashed-dotted lines are best fits to exponential (A) and power-law PDFs (B). In (A), they correspond to for PDF of of fast endosomes (dashed line) and for PDF of of slow endosomes (dashed-dotted line). In (B) they correspond to for PDF of of fast endosomes (dashed line) and for PDF of of slow endosomes (dashed-dotted line).

