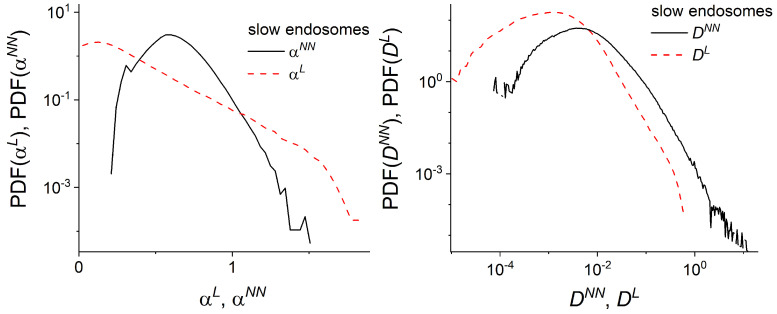
Figure A4.
Slow endosomes. (Left) Distribution of anomalous exponents of slow moving endosome trajectories (the solid curve) compared with the distribution of local anomalous exponents of slow moving endosome trajectories (the dashed curve); (Right) Distribution of generalized diffusion coefficients of slow moving endosome trajectories (the solid curve) compared with the distribution of local generalized diffusion coefficients of slow moving endosome trajectories (the dashed curve).

