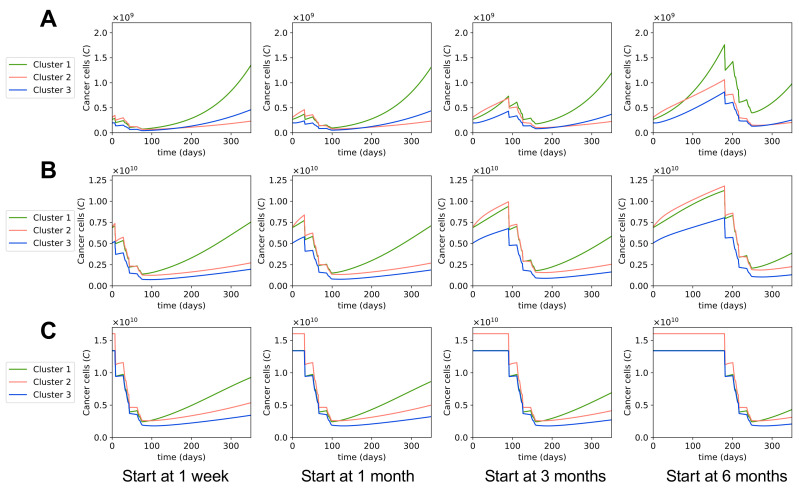
Figure 6.
Dynamics with different start times of MAP treatment. Sub-figures (A–C) show the dynamics of cancer cell populations for different MAP treatment start times in small, medium, and large tumors, respectively. In each sub-figure, from left to right: the treatment started 1 week, 1 month, 3 months, or 6 months after initial diagnosis.

