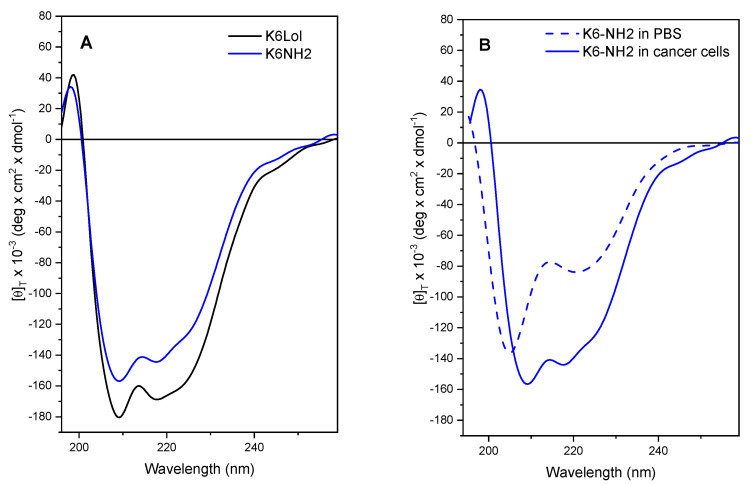
Figure 9.
Circular dichroism profiles of K6-Lol and K6-NH2 in the presence of cancer cells. (A) L-428 cells were treated with peptaibols and the peptide 3D structure was analyzed by CD. The two peptaibols adopt a stable helical conformation (peptide concentration: 10 µM). (B) Comparison between the CD profiles acquired for K6-NH2 in the presence (full line) or absence (dashed line) of cancer cells. The increase in the intensity of the band at about 220 nm for the peptide in the presence of cancer cells (panel B, full line) is indicative of the onset of peptide aggregation in cancer cells and not in PBS buffer alone.

