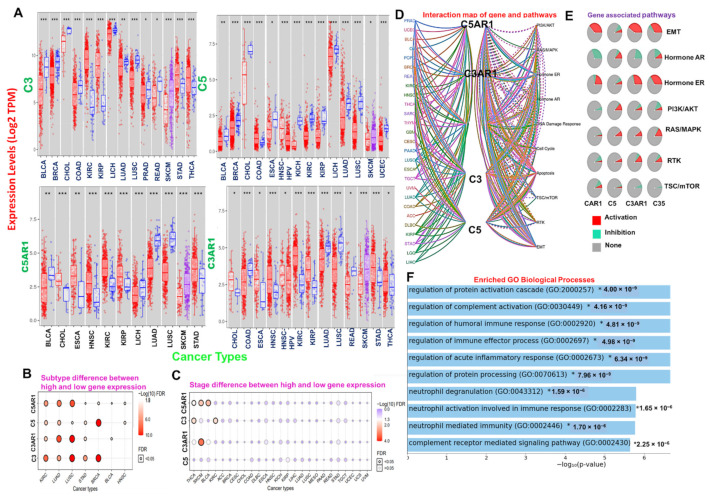
Figure 1.
Differential expression of C3, C5, C3AR1, and C5AR1 in human malignancies is associated with activation of immune-related oncogenic processes and poor prognosis of cancer patients. (A) Comparative C3, C5, C3AR1, and C5AR1 expression profiles between tumor and adjacent normal samples across the TCGA database. The blue and red plots represent the tumor and normal sample, respectively. A heat map showing the difference in gene expression between (B) the tumor subtypes and (C) TNM stages across the TCGA database. The color from white to red represents the FDR significance. The bubble color from blue to red and the size represent the FDR significance. The black outline border indicates FDR < 0.05. (D) Interaction map of genes and pathways. C3, C5, C3AR1, and C5AR1 (E) associated pathways (F) and enriched biological processes. *: p-value < 0.05; **: p-value < 0.01; ***: p-value < 0.001.

