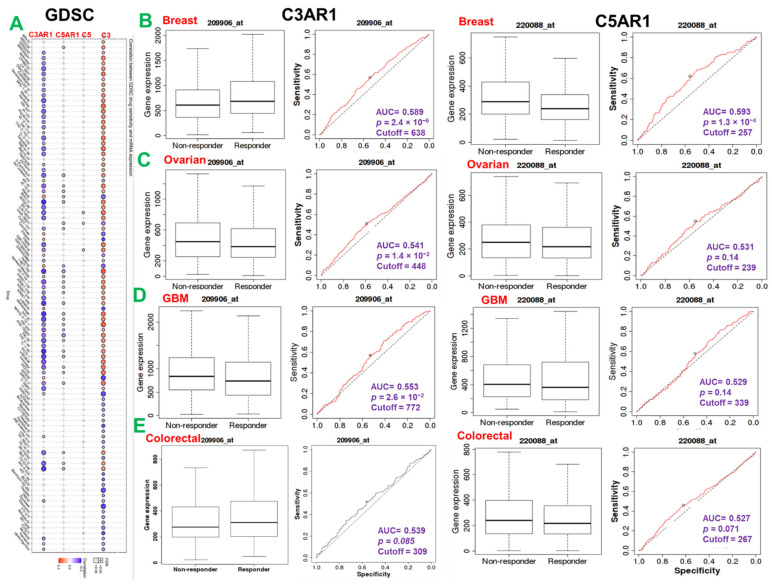
Figure 5.
C3, C5, C3AR1, and C5AR1 expression is associated with response to chemotherapy in multiple cancer types. (A) Bubble plot of the correlation between GDSC drug sensitivity and mRNA expression of C3, C5, C5AR1, and C3AR1. The color from blue to red represents the correlation between mRNA expression and IC50. A positive correlation means that a gene with a high level of expression is resistant to the drug and vice versa. The bubble size positively correlates with the FDR significance. The black outline border indicates FDR < 0.05. The ROC plot of the association between C3AR1/C5ARI expression and the response to therapy of brain (D), breast (B), ovarian (C), and colorectal cancer (E).

