Figure 6.
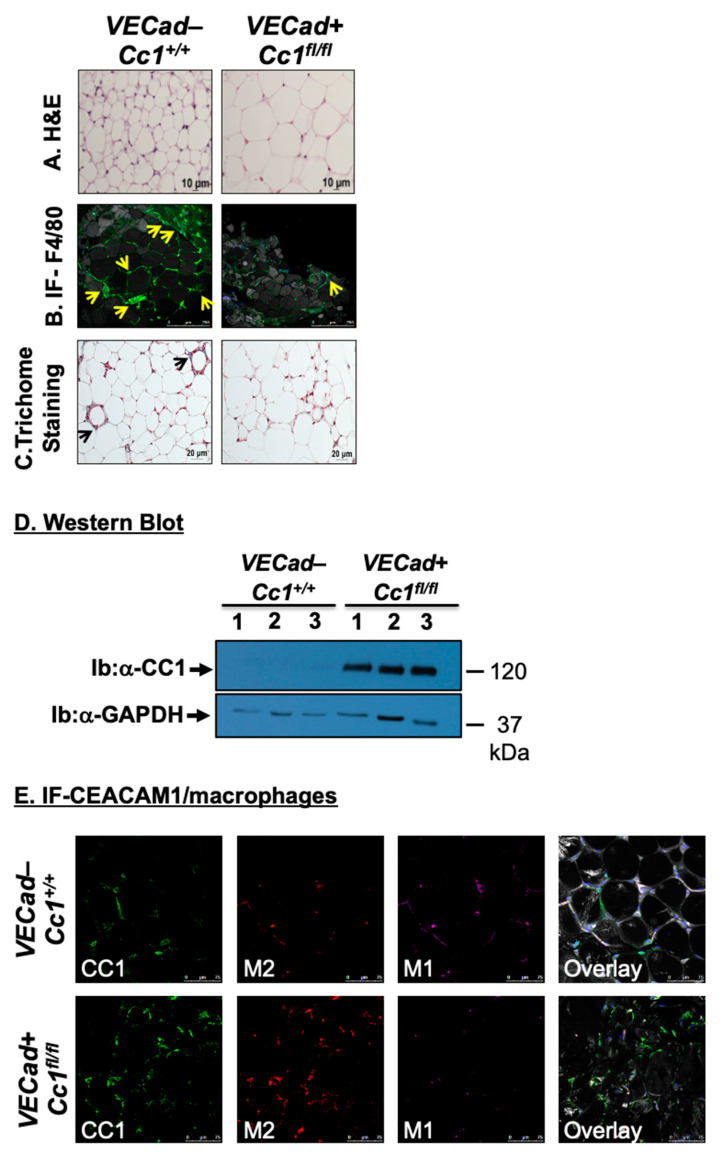
White adipose tissue histology and CEACAM1 expression. (A) White adipose tissue histology was assessed in H&E-stained sections (n > 4 mice/genotype). It indicates adipocytes’ expansion in KO versus WT. Representative images from three sections per mouse are shown. Scale bar: 10 µm. (B) Whole WAT was stained with BODIPY 558/568 to detect lipid (gray) and with anti-F4/80 to detect macrophages (green) and DAPI (blue) to detect nuclei. All images were captured using LSCM with a 20× objective and are 2D projections of a 3D image z-stack. Scale bar: 250 µm. Yellow arrows show multiple areas with crown-like structures (CLS) containing macrophages (green) surrounding adipocytes (gray). Small pieces of lipid are visible inside the macrophages of wild-type (left panels). In the right panel, a representative projection from KO mice is shown. A yellow arrow points to the single lipid-free CLS detected in the image (yellow arrow) surrounding one adipocyte from KO mice. Representative images from three sections per mouse are shown. (C) White adipose tissue from 5 mice/genotype was analyzed by trichome staining to detect collagen deposition. Representative images from three sections per mouse are shown. Scale bar: 20 µm. Black arrows point to trichome blue-stained collagen deposits in wild-type mice than in the EndoCC1 KO mice. (D) WAT lysates from 8-month-old mice were analyzed by immunoblotting the upper half of the membrane with α-CEACAM1 (CC1) antibody and normalizing the lower half with α-GPADH antibody to normalize against the total amount of proteins loaded. Gels represent two separate/repeated experiments. (E). Immunofluorescence analysis of white adipose tissue. Whole WAT tissue from WT and KO mice was stained with anti-CC1 (green) with APC anti-mouse CD301 (MGL1/MGL2) for M2 macrophages (red) and with anti-CD11c hamster anti-mouse antibody for M1 macrophages (magenta). The last panel is the overlay of all of the antibodies under consideration. All images were captured using LSCM with a 20× objective and are 2D projections of a 3D image z-stack. Scale bar: 75 µm. Representative images from three sections per mouse are shown.

