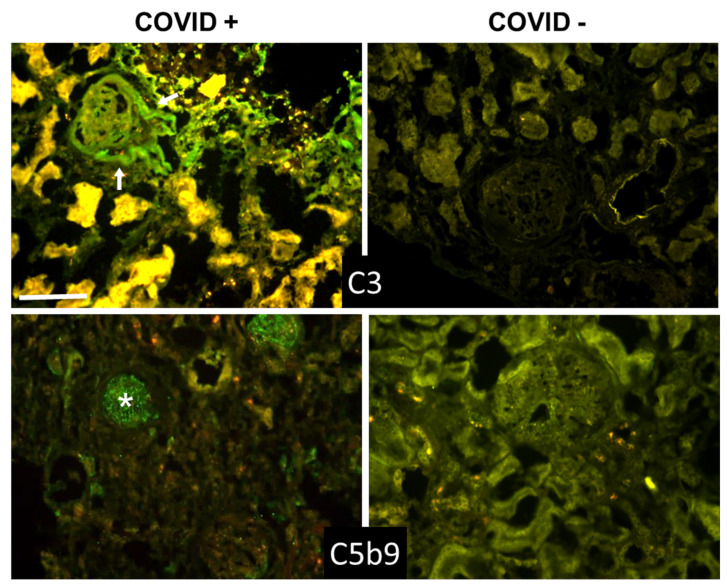
Figure 4.
Detection of C3 and C5b-9 in kidney sections by immunofluorescence analysis. The panel shows representative immunofluorescence images obtained from the analysis of several sections of kidney autopsy samples from 12 SARS-CoV-2-positive and 3 negative cases. See legend to Figure 1 for further details. White arrows in C3 image show periglomerular deposition; * in C5b-9 image shows glomerular staining. Scale bar = 50 µm.

