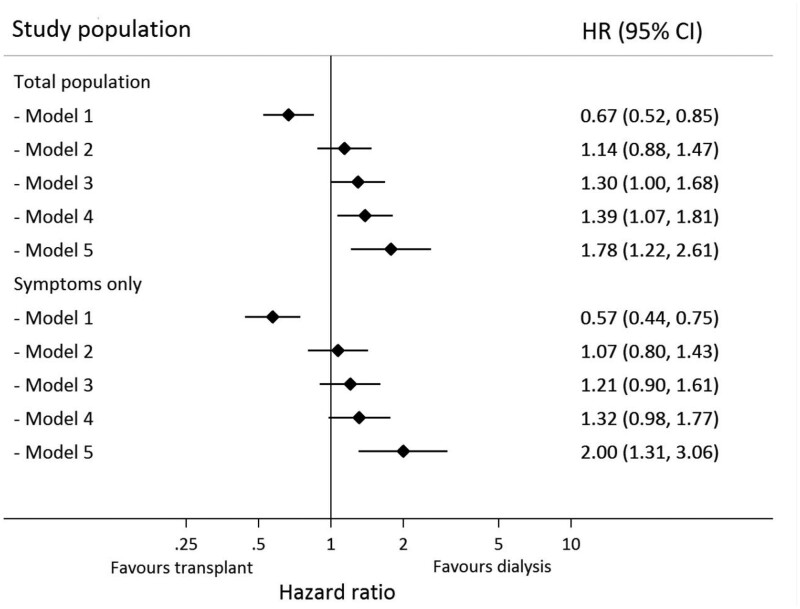
FIGURE 1.
Forest plot showing HRs for association of type of KRT (KT versus HD) with 28-day mortality in the total study population and in the subgroup of those patients tested for COVID-19 based on symptoms only. Model 1: crude; Model 2: age, sex; Model 3: Model 2 + frailty; Model 4: Model 3 + obesity, hypertension, diabetes, heart failure, chronic lung disease and smoking; Model 5: Model 4 + duration of kidney failure and kidney function.

