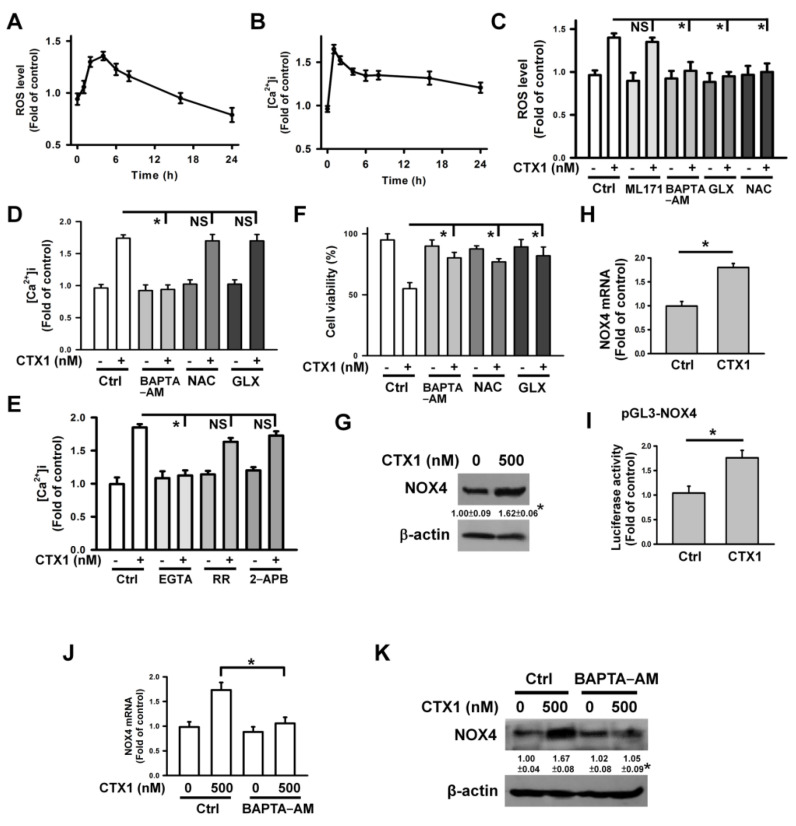
Figure 3.
Effect of CTX1 on [Ca2+]i and ROS level in U937 cells. U937 cells were treated with 500 nM CTX1 for 2 h (for measuring [Ca2+]i) or 4 h (for measuring ROS level and cell viability). On the other hand, U937 cells were pretreated with 2 mM N-acetylcysteine (NAC), 10 μM BAPTA-AM, 10 μM GLX351322, 10 μM ML171, 10 μM EGTA, 10 μM ruthenium red (RR), or 50 μM 2-aminoethoxydiphenyl borane (2-APB) for 1 h and then incubated with 500 nM CTX1 for 2 h (for measuring [Ca2+]i) or for 4 h (for measuring ROS level and cell viability). (A) CTX1 induced ROS generation in U937 cells. U937 cells were treated with 500 nM CTX1 for indicated time periods. Results were shown as fold-increase in fluorescence intensity compared with the control group. Each value is the mean ± SD of three independent experiments with triplicate measurements. (B) CTX1 induced an elevation of [Ca2+]i in U937 cells. U937 cells were treated with 500 nM CTX1 for indicated time periods. Results were shown as fold-increase in fluorescence intensity compared with the control group. (C) Effect of BAPTA−AM, NAC, ML171, and GLX351322 on CTX1-induced ROS generation (mean ± SD, * p < 0.05; NS, not statistically significant). (D) Effect of BAPTA−AM, NAC, and GLX351322 on CTX1-induced an increase in [Ca2+]i (mean ± SD, * p < 0.05; NS, not statistically significant). (E) Effect of EGTA, ruthenium red, and 2−APB on CTX1-induced an increase in [Ca2+]i (mean ± SD, * p < 0.05; NS, not statistically significant). (F) Effect of BAPTA−AM, GLX351322, and NAC on the viability of CTX1-treated cells (mean ± SD, * p < 0.05). (G) Effect of CTX1 on NOX4 protein expression (* p < 0.05, CTX1-treated cells compared to untreated control cells). (H) Detecting the expression of NOX4 mRNA using qRT-PCR (mean ± SD, * p < 0.05). (I) Effect of CTX1 on the luciferase activity of NOX4 promoter construct. After transfection with indicated plasmid for 24 h, transfected cells were treated with 500 nM CTX1 for 4 h and then harvested for measuring luciferase activity (mean ± SD, * p < 0.05). (J) Effect of BAPTA−AM on the expression of NOX4 mRNA in CTX1-treated cells (mean ± SD, * p < 0.05). (K) Effect of BAPTA−AM on the expression of NOX4 protein in CTX1-treated cells (* p < 0.05, BAPTA−AM/CTX1-treated cells compared to CTX1-treated cells).

