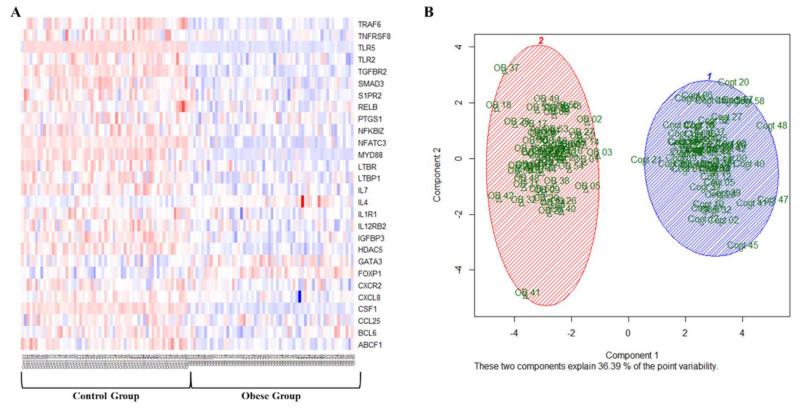
Figure 3.
Differentially methylated adipokines in VAT biopsies. (A) A representative heatmap of the promoter methylation % of 24 differentially methylated adipokines in VAT samples obtained from obese and non-obese subjects (n = 60, each). The heatmap uses a color key that ranges from red (high) to blue (low) based on methylation level. (B) A scatterplot of the first two principal components demonstrates a general separation of the obese and non-obese phenotypes.

