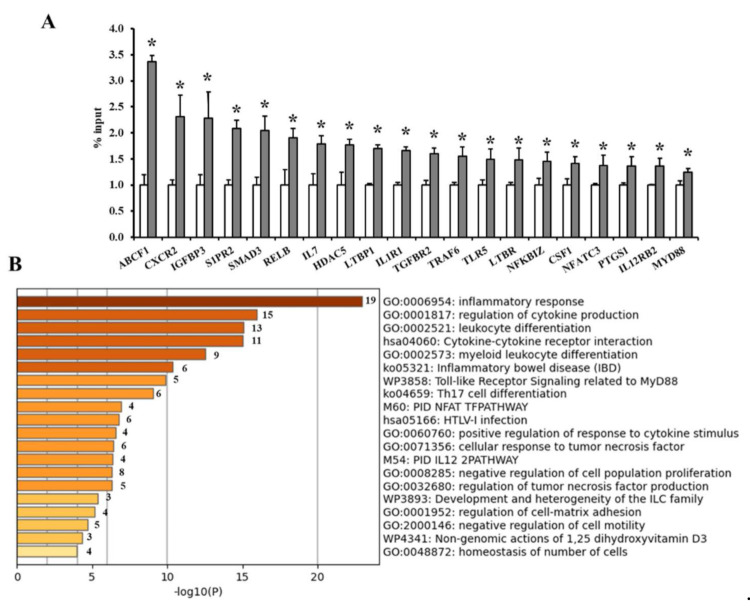
Figure 4.
TET1 occupancy at adipokine promoters and gene enrichment analysis. (A) Average binding occupancy of TET1 across adipokine promoters in obese subjects measured via ChIP-qPCR assays and normalized to non-obese controls (n = 60, each). Results are shown as means ± standard error (SE), and the * symbol reflects a p-value < 0.05 when comparing obese subjects with controls. (B) Heatmap of enriched terms across the input differently methylated gene lists, colored by p-values, via the Metascape.

