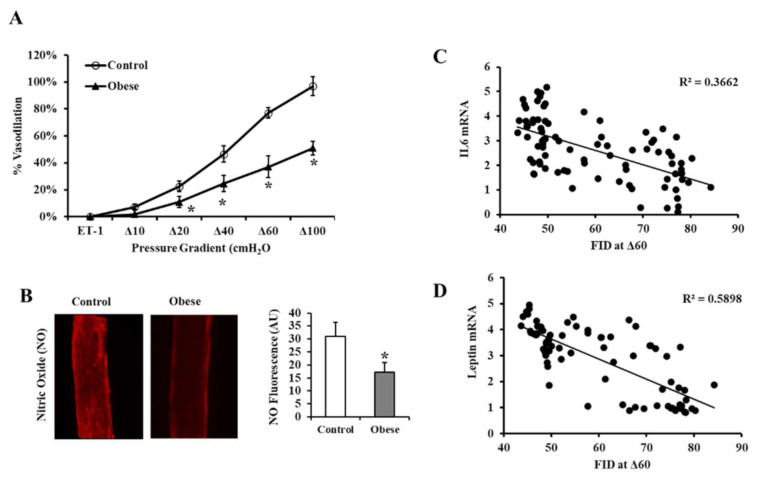
Figure 6.
FID measurements in VAT-isolated resistance arterioles. (A) FID measurements correspond to increasing intraluminal pressure gradients of 10–100 cmH2O in VAT arterioles obtained from obese (n = 60) and non-obese (n = 60) subjects. (B) Representative images by fluorescence microscopy of NO generation in VAT-isolated arterioles (n = 60, each). (C) Charts represent NO fluorescent signals measured and expressed in arbitrary units using NIH Image J software. (D) Scatter plots and Spearman correlation coefficient (r) of leptin and IL6 mRNA levels and arteriolar FID. Results are shown as means ± standard error (SE), and the * symbol reflects a p-value < 0.05 when comparing obese subjects with controls.

