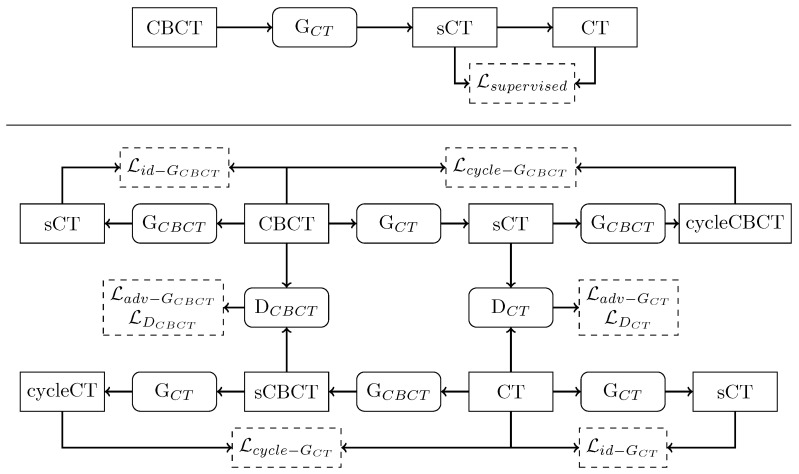
Figure 4.
Schematic flow chart of supervised (upper panel) and unsupervised (bottom panel) training routines. Rectangle boxes represent images, and rounded corner boxes depict neural network models. Dashed boxes indicate a loss function. For a detailed explanation of the training routines, refer to the Appendix A.

