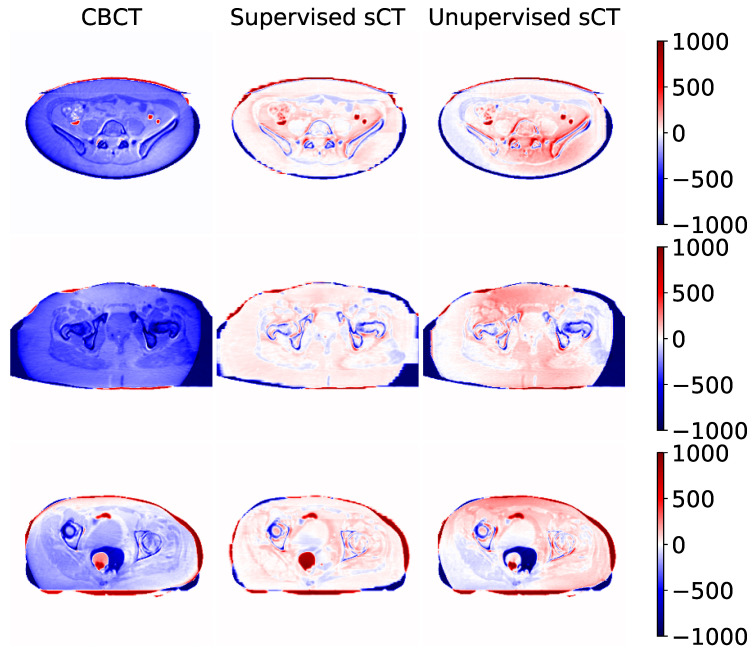
Figure 7.
Difference maps computed between original CBCT, sCT supervised, and sCT unsupervised using their corresponding CT as reference. Numeric values are in Hounsfield Units. Each row represents a different example taken from a different subject. The examples depicted in this figure correspond to the example presented in Figure 6.

