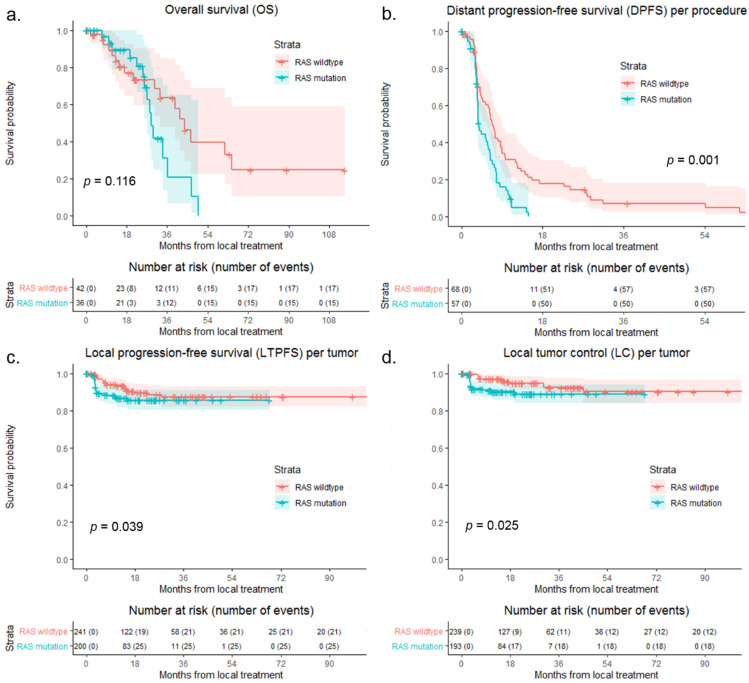
Figure 3.
Kaplan–Meier curves, with log-rank (Mantel–Cox) test or Gehan–Breslow–Wilcoxon test, of (a) overall survival (OS) per patient (p = 0.116), (b) distant progression-free survival (DPFS) per procedure (p = 0.001), (c) local tumor progression-free survival (LTPFS) per tumor (p = 0.039), and (d) of local control (LC) per tumor (p = 0.025) after local treatment comparing RAS wildtype (blue) to RAS mutation (pink). Numbers at risk (number of events) are per patient, per procedure and per tumor. Death without distant progression, local tumor progression (LTP), or loss of LC (competing risk) is censored.

