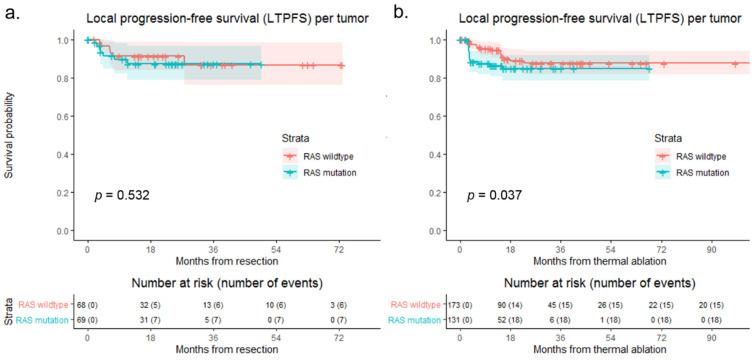
Figure 4.
Kaplan–Meier curves with Gehan–Breslow–Wilcoxon test, of (a) local tumor progression-free survival (LTPFS) per tumor following resection (p = 0.532) and (b) LTPFS per tumor following thermal ablation (p = 0.037) comparing RAS wildtype (blue) to RAS mutation (pink). Numbers at risk (number of events) are per tumor. Death without local tumor progression (LTP; competing risk) is censored.

