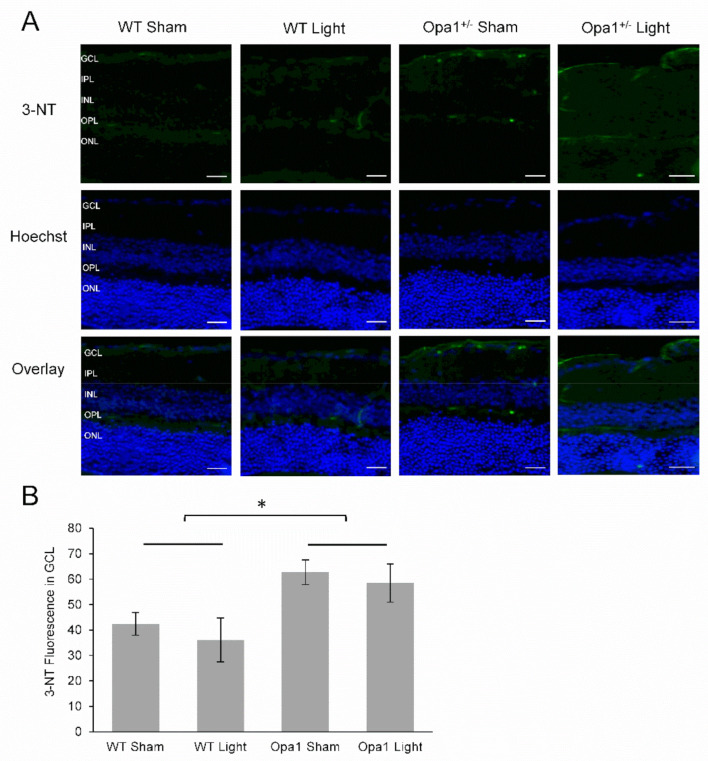
Figure 4.
Aged Opa1+/− mice had increased levels of 3-Nitrotyrosine in the GCL. (A) Representative images from 3-nitrotyrosine (3-NT) immunostaining. The top row shows 3-NT staining in green, the middle row is a nuclear stain, and the bottom row shows the overlay of the two stains. GCL: ganglion cell layer; IPL: inner plexiform layer; INL: inner nuclear layer; OPL: outer plexiform layer; ONL: outer nuclear layer. Scale bar represents 20 µm. (B) Quantification of fluorescence showed significantly increased levels of 3-NT in Opa1+/− mice compared to WT controls. WT Sham (n = 3), WT Light (n = 4), Opa1+/− Sham (n = 4), Opa1+/− Light (n = 2). * p < 0.05, two-way ANOVA.

