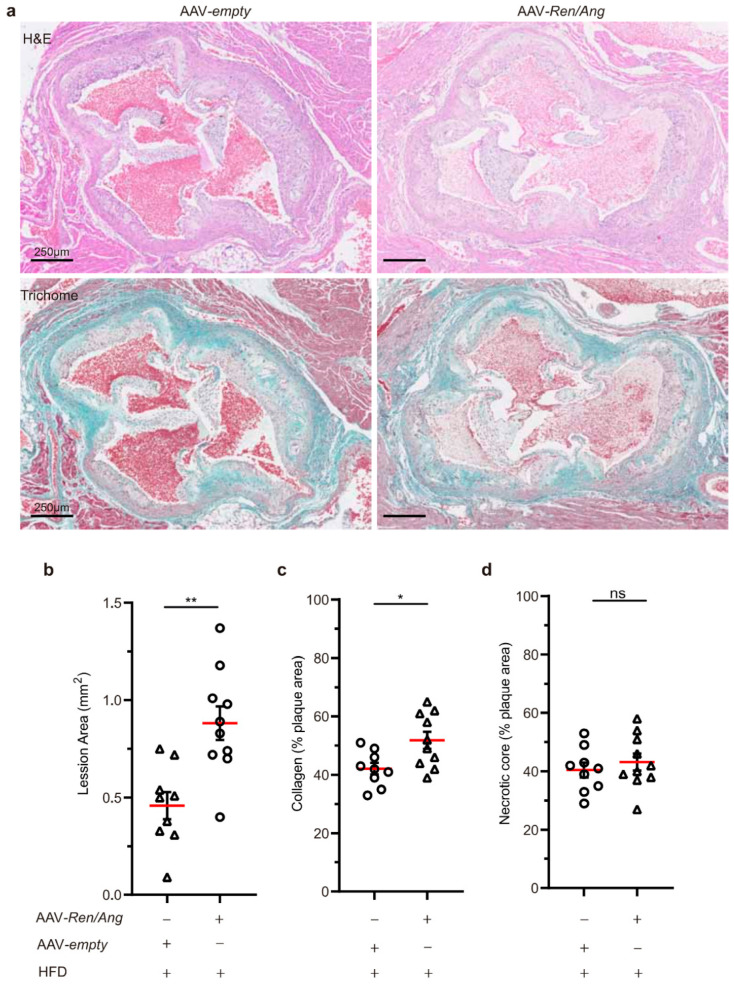
Figure 3.
Non-optimal BP increases atherosclerosis at the aortic root. (a) Representative whole view of aortic roots from AAV-empty control and AAV-Ren/Ang-injected ApoE−/− mice stained with H&E and Masson’s trichrome. Aortas were extracted 10 weeks after starting the HFD. Scale bar, 250 μm. (b) Quantification of atherosclerotic plaque area from a (n = 9–10 AAV-empty and AAV-Ren/Ang mice) indicated as mm2. (c,d) Quantification of collagen and necrotic core area expressed as a percentage of the total plaque cross-sectional area (n = 9-10). Data in (b–d) are mean ± SEM. * p < 0.05, ** p < 0.01, ns, non-significant, Student t-test.

