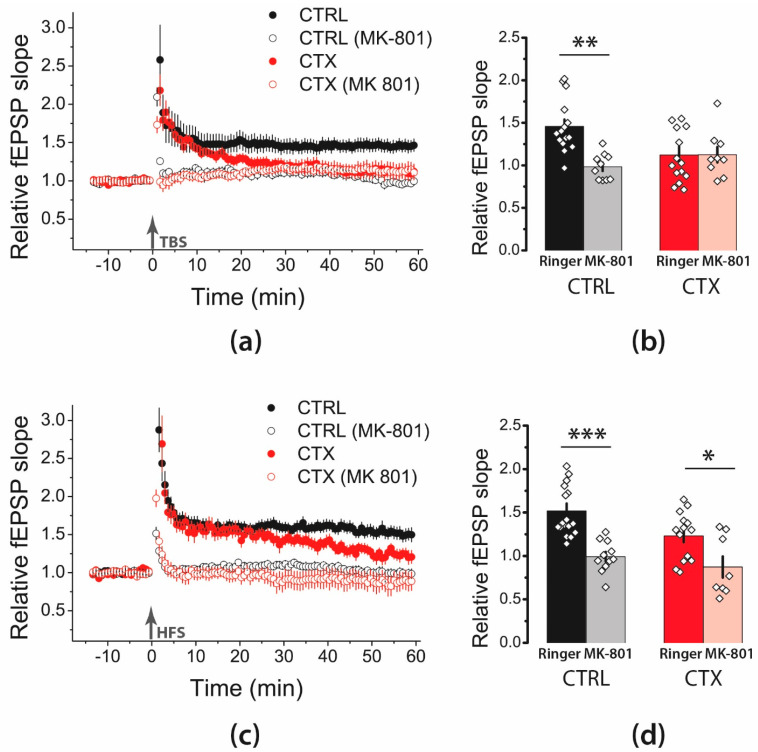
Figure 2.
NMDAR-dependent mechanism of LTP induction is unaltered following administration of CTX. (a,c) Diagram showing changes in the value of the normalized slope of fEPSP in the control (CTRL) and CTX-treated groups (CTX) after TBS (a) and HFS (c). (b,d) Diagrams illustrating the magnitude of plasticity in the control and CTX groups in the presence of MK-801, after TBS (b) or HFS (d). Black arrow indicates the moment of LTP induction (TBS or HFS). Two-way ANOVA following Tukey post hoc tests were used. All the data are presented as mean ± standard error of the mean. * p < 0.05, ** p < 0.01, *** p < 0.001: A significant difference versus the control group (Tukey’s post hoc test).

