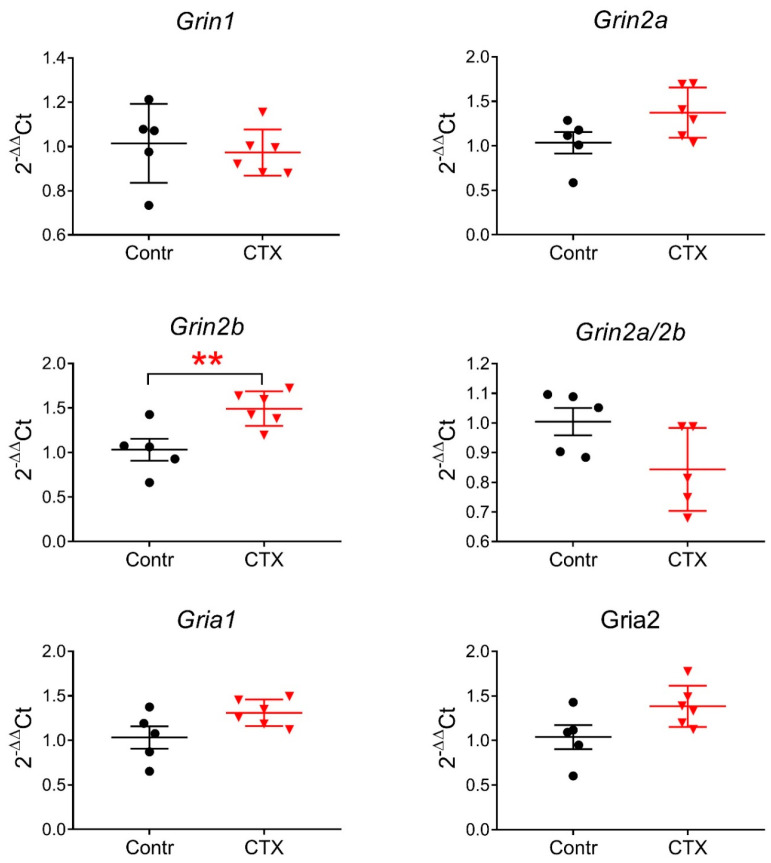
Figure 4.
The relative expression of the Grin1, Grin2a, Grin2b, Gria1, Gria2 genes, and Grin2a/Grin2b ratio in the dorsal hippocampal area after CTX treatment. Contr—control group, CTX—experimental group. Data are presented as a mean with a standard error of the mean. Each dot (circle, triangle) represents a value obtained in individual animal. ** p < 0.01, a significant difference versus the control group according to the Student’s t-test.

