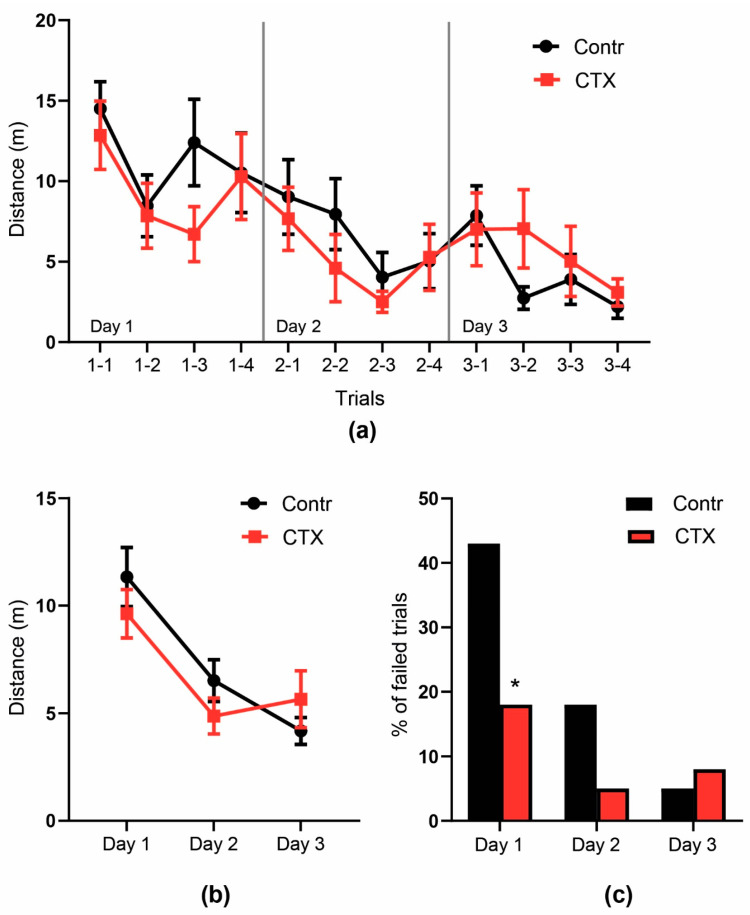
Figure 6.
The behavior of CTX-treated rats in the Morris water maze. (a) distance traveled from the start point to the hidden platform during the 90-s trial, (b) the rate of failed trials during each day, * significant differences between the groups, Fisher’s exact test, p < 0.05, (c) mean distance traveled during four trials each day.

