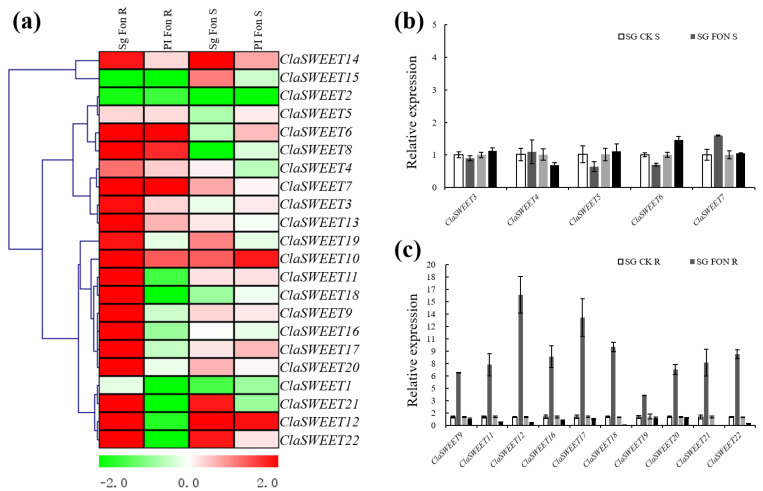
Figure 7.
(a) Gene expression heatmap of the expressed ClaSWEET genes in the root and stem tissues of PI (PI296341-FR) and Sg (Sugar baby) after being infected with Fusarium wilt. Sg Fon R (infected root samples of Sugar baby); PI Fon R (infected root samples of PI296341-FR); Sg Fon S (infected stems of Sugar baby); PI Fon S (infected stems of PI296341-FR). Red: upregulated. Green: downregulated. Gene clusters were generated by average linkage clustering method. (b) Relative expressions of ClaSWEET7, 15, and 19-21 in the stem of Sg and PI. (c) Relative expressions of ClaSWEET9, 11, 12, and 16-22 in root tissue of Sg and PI.

