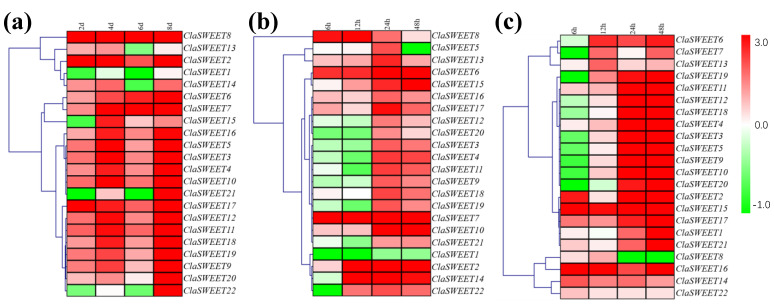
Figure 8.
Gene expression heatmap of the ClaSWEET genes in the YL leaf under drought (a), salt (b), and low-temperature stress (c). The plant samples at 0 dpt and 0 hpt were considered as controls. Red: upregulated. Green: downregulated. The gene clusters were obtained with the average linkage clustering method.

