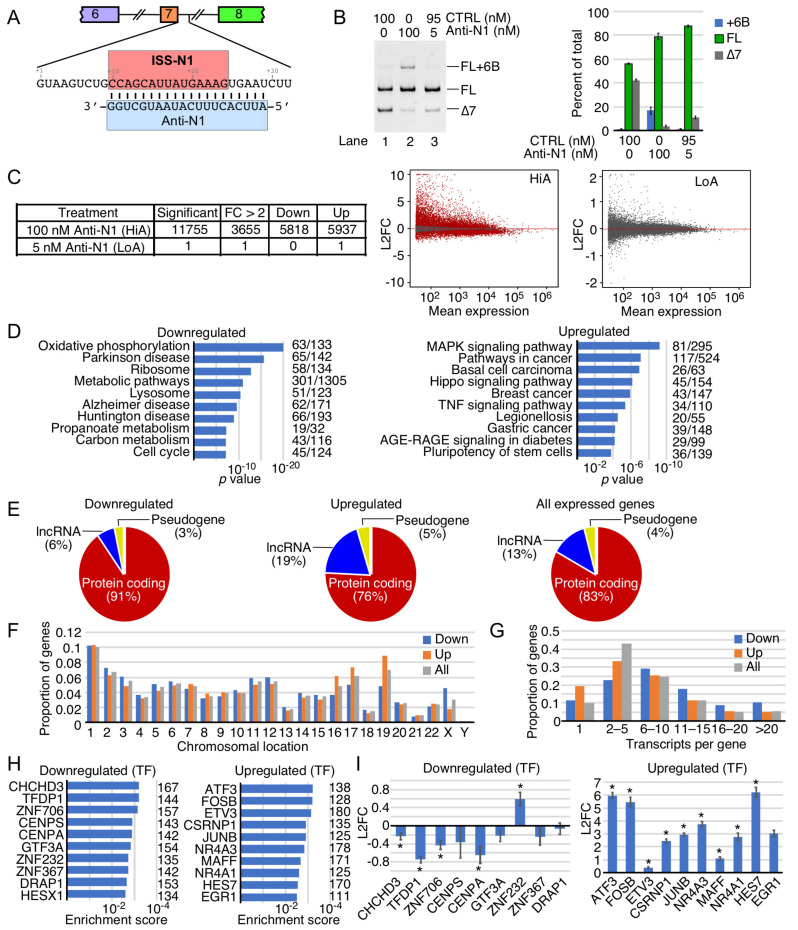
Figure 1.
Gene expression after treatment with Anti-N1 ASO. (A). Schematic of Anti-N1 and its intronic target sequence ISS-N1. Exons are depicted as colored-numbered boxes, and introns are depicted as broken lines. The sequence immediately downstream of exon 7 is depicted below. Nucleotide numbering starts from the first position of intron 7. ISS-N1 is boxed in red and Anti-N1 ASO is marked with a blue box. Black lines show base pairing between Anti-N1 and its target sequence. (B). Alternative splicing of SMN2 exon 7 after treatment with the indicated concentrations of Anti-N1. Left panel: representative ethidium bromide-stained gel depicting semiquantitative RT-PCR of SMN2 (from exon 6 to exon 8). ASO concentrations are provided at the top of the gel. Splice isoform identity is provided at the right side of the gel. Right panel: densitometric quantification of RT-PCR results. Error bars represent the standard error of the mean. n = 3. Abbreviations: CTRL, control ASO; FL, canonical full-length isoform. (C). Overview of differential expression analysis of RNA-Seq performed on Anti-N1-treated GM03813 SMA patient fibroblasts. Left panel: Overall summary table describing the number of genes with altered expression after Anti-N1 treatment as compared to the nontargeting control ASO. “Significant” indicates genes with Benjamini and Hochberg adjusted p values (adj. p) < 0.05. FC > 2 indicates genes with more than 2-fold up- or downregulation. Right two panels: MA plot depicting gene expression changes upon cell treatment with Anti-N1. Y axis represents the log2 fold change in transcript levels in Anti-N1 treated cells as compared with the nontargeting control ASO. X axis represents the mean expression in normalized read counts per gene. Red dots indicate genes with significantly altered expression levels (adj. p < 0.05). Grey dots indicate unchanged genes. Abbreviations: L2FC, log2 fold change; HiA, 100 nM anti-N1 treatment; LoA, 5 nM anti-N1 treatment. (D). The top 10 enriched Kyoto Encyclopedia of Genes and Genomes (KEGG) pathways among downregulated (left panel) and upregulated (right panel) genes. Pathway names are provided at the left side, and number of affected genes/total genes in each pathway are indicated at the right side. X axis represents p value of enrichment. (E). Proportion of genes coding for mRNAs, lncRNAs, and pseudogene transcripts among downregulated (left), upregulated (middle), and all expressed genes in GM03813 cells (right). (F). The chromosomal distribution of significantly downregulated (blue), upregulated (orange), and all expressed genes (gray). (G). The proportion of significantly downregulated (blue), upregulated (orange) and all expressed genes (gray) that encode different numbers of alternative transcripts. (H). The 10 most significant transcription factors whose targets are enriched in genes downregulated (left panel) and upregulated (right panel) by HiA treatment. Each transcription factor is indicated at the left side, and number of significantly affected target genes is indicated at the right side. X axis indicates statistical significance. (I). The relative expression levels of transcription factors described in H after HiA treatment. Y axis represents L2FC compared to control. *—adj. p < 0.05.

