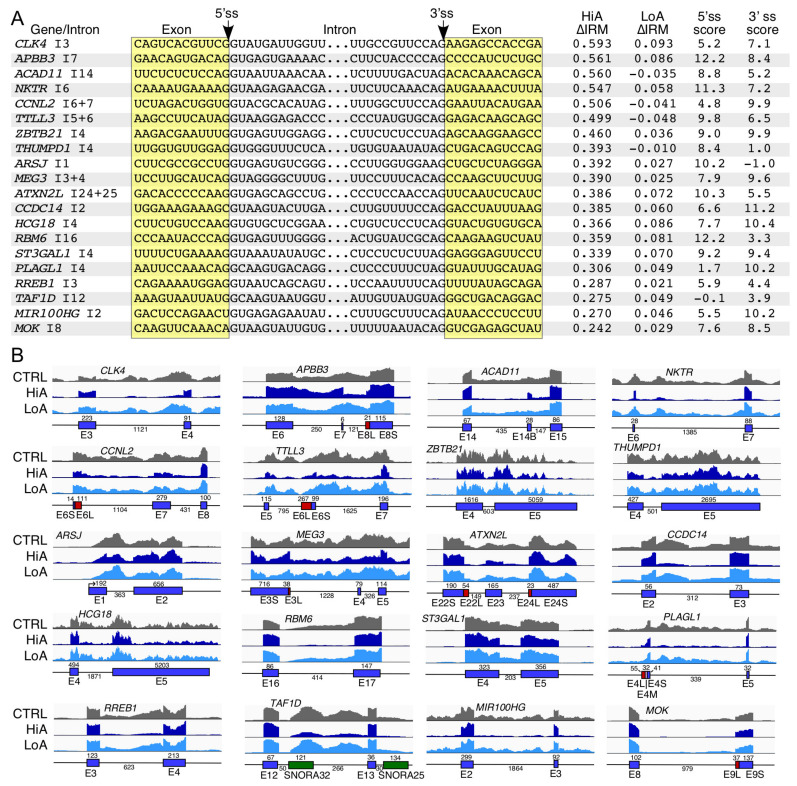
Figure 6.
Increased intron removal caused by Anti-N1 treatment. (A). The sequence context of 20 candidate introns exhibiting greatly increased removal upon Anti-N1 treatment; 12 nucleotide-long sequences upstream and downstream of each indicated splice site of the affected introns are shown. ∆IRM indicates the change in proportional intron removal vs. intron retention. Other table contents and annotation are the same as in Figure 3A. (B). Genomic views of several candidate introns with increased removal after Anti-N1 treatment. In exons with 3 alternative 5′ or 3′ss, the intermediate region is colored pink. Other labeling and coloring are the same as in Figure 3C.

