Figure 8.
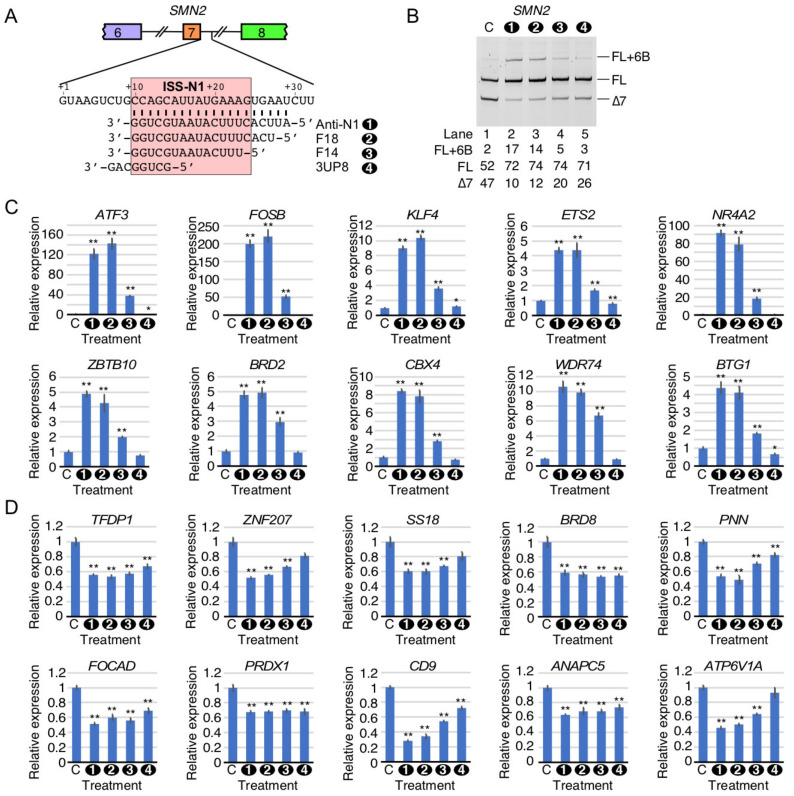
Comparison of perturbed expression of genes by ISS-N1-targeting splice-switching oligonucleotides. (A). Sequences and target binding sites of four Anti-N1 targeting splice switching oligonucleotides (ISOs). Labeling and coloring is the same as Figure 1A. For brevity and clarity, the ISOs are numbered 1–4 as indicated. (B). Effects of ISO treatment on SMN2 splicing. Treatments are indicated at the top of the gel, with “C” signifying the treatment with the nontargeting control ASO. Splice isoform identity is indicated at the right side of the gel. The percent of total transcript for each splice isoform is indicated below the gel. (C). qPCR validation of the upregulated genes after ISO treatment. Gene symbols are shown at the top of each panel. Y axis: relative expression to non-targeting control. Treatments are indicated at the bottom of each graph, with “C” signifying the treatment with the nontargeting control ASO. Error bars represent the standard error of the mean. n = 3. *: p < 0.05. **: p < 0.01. (D). qPCR validation of the downregulated genes after ISO treatment. Labeling is the same as in panel C.

