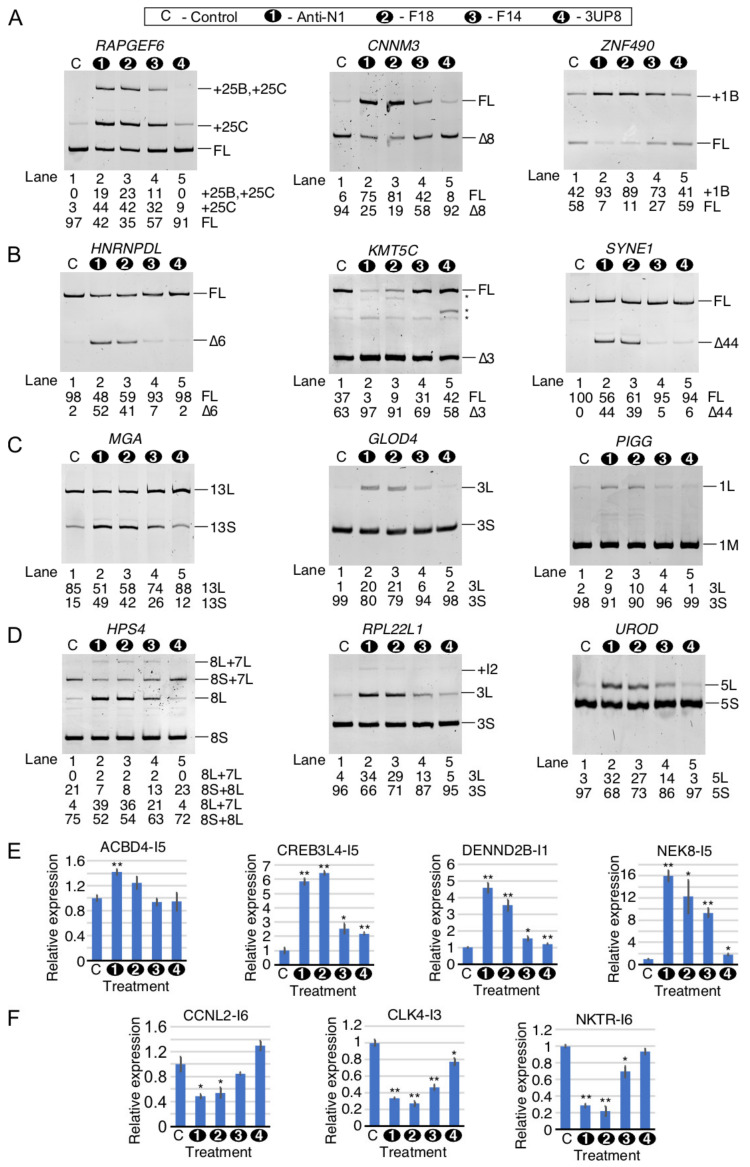
Figure 9.
Comparison of perturbed splicing events by ISS-N1-targeting splice-switching oligonucleotides. (A). Validation of enhanced exon inclusion (EIN) events triggered by ISO treatments. Representative ethidium bromide-stained gels depicting semiquantitative RT-PCR of RAPGEF6, CNNM3, and ZNF490 capturing the splicing event of interest. The gene name and the type of ISO treatment are indicated at the top of each gel. Similar to Figure 8A, the ISOs are numbered 1–4 and “C” signifies the treatment with the nontargeting control ASO. Splice isoform identity is indicated at the right side of the gel. Asterisks (*) indicate minor non-specific PCR products. The percent of total transcript for each splice isoform is indicated below each gel. (B). Validation of enhanced exon skipping (ESK) events triggered by ISO treatments. Representative ethidium bromide-stained gels depicting semiquantitative RT-PCR of HNRNPDL, KMT5C, and SYNE1 (to capture the relevant splicing event). Labeling is the same as in panel A. (C). Validation of alternative 3′ss (A3S) usage upon ISO treatments. Representative ethidium bromide-stained gels depicting semiquantitative RT-PCR of MGA, GLOD4, and PIGG (to capture the relevant splicing event). Labeling is the same as in panel A. (D). Validation of alternative 5′ss (A5S) usage upon ISO treatment. Representative ethidium bromide-stained gels depicting semiquantitative RT-PCR of HPS4, RPL22L1, and UROD (to capture the splicing event of interest). Labeling is the same as in panel A. (E). qPCR validation of enhanced intron retention (IRT) events in ACBD4, CREB3L4, DENND2B, and NEK8 in transcripts. Labeling is the same as in Figure 8C. (F). qPCR validation of enhanced intron removal (IRM) events in CCNL2, CLK4, and NKTR in transcripts. N = 3. *: p < 0.05. **: p < 0.01. Labeling is the same as in Figure 8C.

