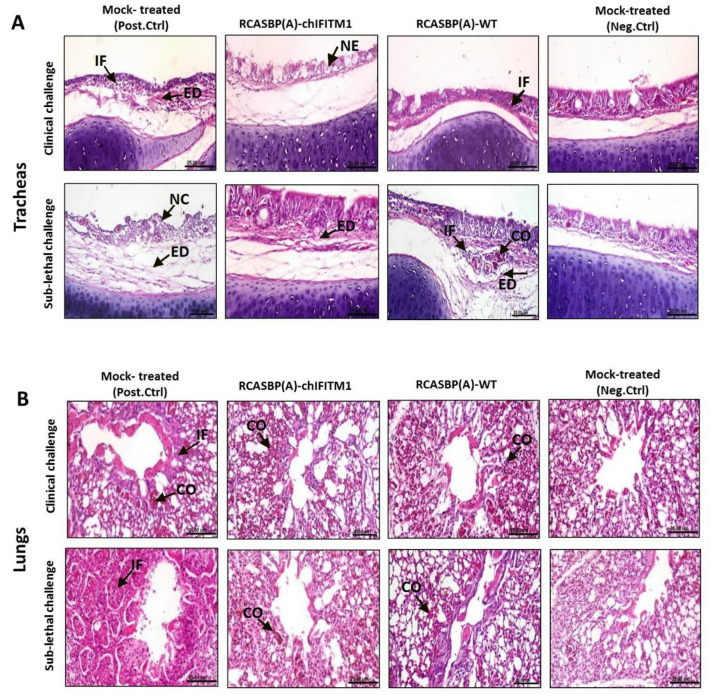
Figure 5.
Photomicrographs representing H & E-stained sections of tracheas (A) and lungs (B) collected from RCASBP(A)-chIFITM1 and RCASBP(A)-WT challenged chicks with clinical and sub-lethal doses of H5N1 HPAIV compared to mock inoculated chicks (negative and positive control groups); showing edema (ED), focal necrosis (NE), inflammatory cells infiltration (IF), congestion (CO) (scale bar 25 μm).

