
Figure 2.
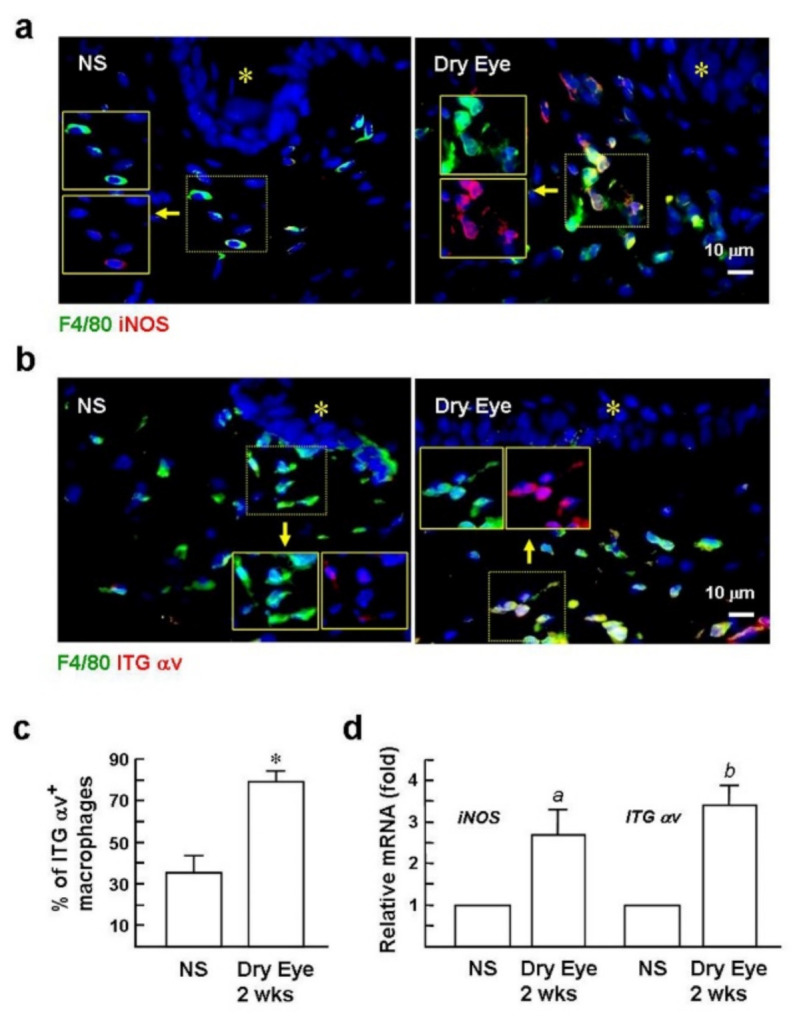
Expression of αv integrin is induced in macrophages in the dry eye. (a,b) Immunofluorescence staining of iNOS, αv integrin, and F4/80 (green; a macrophage marker) in conjunctiva at day 12 after DED induction. Insets are the images before superimposition. Nuclear counterstaining was conducted using Hoechst 33258 (blue). Asterisks indicate conjunctival epithelium. Representative images are from six sections per mouse eye with six mice per group. NS group: mice housed in a stress-free environment. (c) Digital image analysis of the percentages ofαv integrin+ macrophages per total macrophages was performed blindly on an average of six randomly selected × 1000 magnification fields from each section (n = 6) using a Zeiss epifluorescence microscope and Zeiss software. * p < 0.0001 versus NS group. (d) qPCR evaluates the levels of iNOS and αv integrin in the conjunctiva after DED induction for 12 days. Values are expressed as mean ± SE. a p < 0.03 versus NS mice. b p < 0.002 versus NS mice.