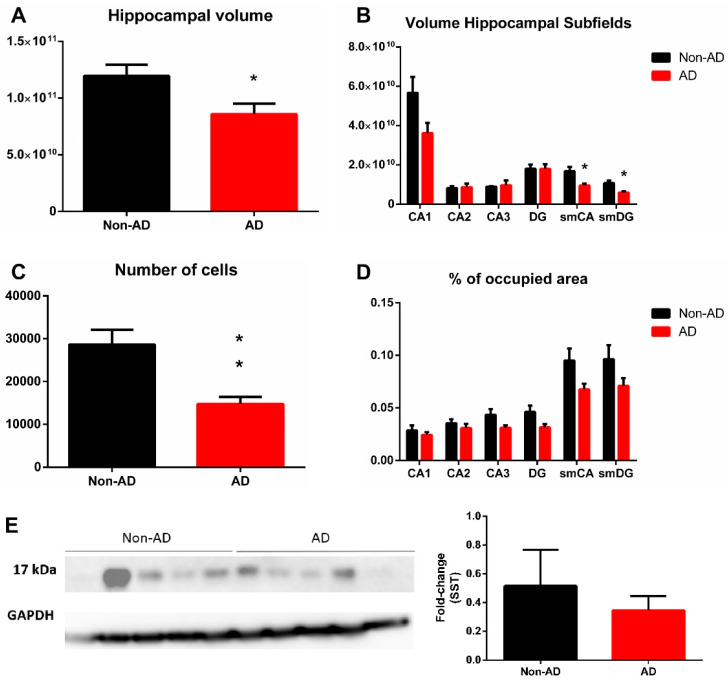
Figure 4.
Quantification of volume and somatostatin expression in the hippocampus. Hippocampal volume was reduced in AD (A), and the molecular layers of CA and DG regions were specifically involved (B). The number of somatostatin-expressing cells was diminished in the whole hippocampus (C), but only a tendency (not significant) was observed in the areas occupied by somatostatin fibers (D). Western blot quantification did not show a significant reduction in somatostatin expression in the hippocampus (E). For volume, number of cells and somatostatin fibers quantification N = 10 formalin-fixed cases (AD = 5 and non-AD = 5) and 4 sections per case were analyzed. Western blot quantification was performed using N = 10 fresh-frozen cases, AD = 5 and non-AD = 5. See Table 1 and supplementary stereological data for further information. * Corresponds to p-value < 0.05.

