Figure 1.
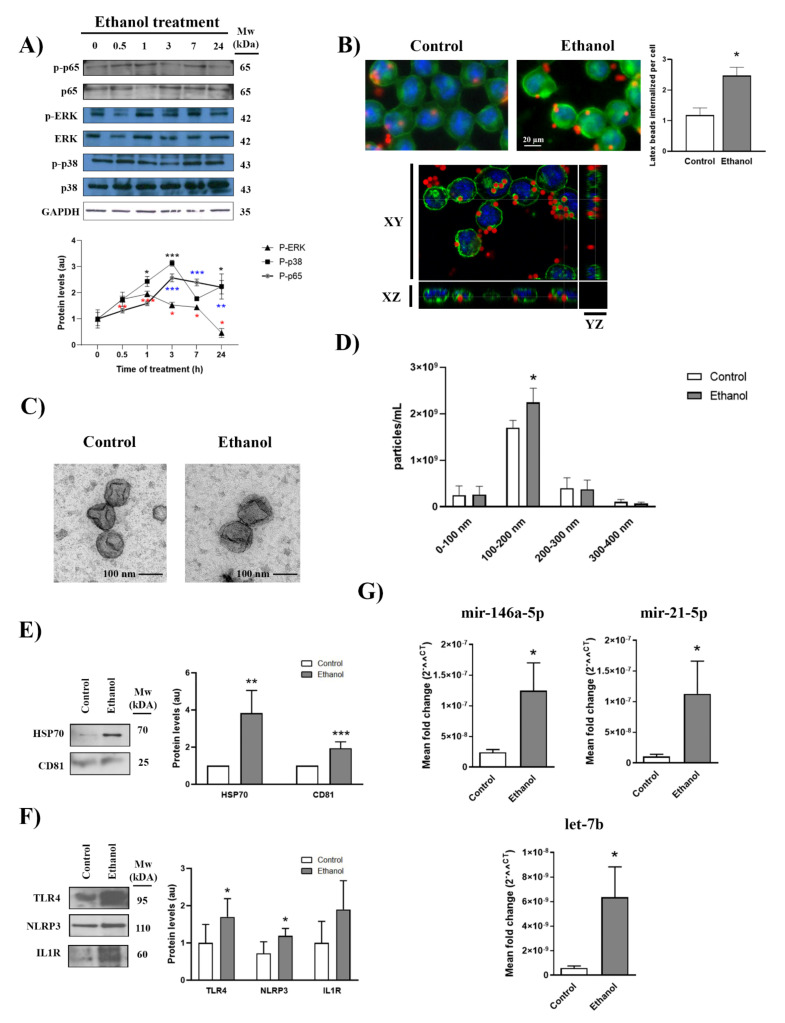
Ethanol activates BV2 microglial cells, increases EV release and alters EV inflammatory molecule concentration. (A) Immunoblot analysis and quantification (au, arbitrary units) of p-ERK, p-p38 and p-p65 in cell extracts of ethanol (50 mM)-treated BV2 cells for different time periods (0, 0.5, 1, 3, 7 and 24 h). Blots were stripped, and the total quantities of ERK, p38, p65 and GAPDH were also assessed. A representative immunoblot of each protein is shown. (B) The BV2 cells treated with or without ethanol for 24 h were exposed to fluorescein-labeled latex beads for 30 min to internalize them, which reveals the phagocytic activity of these cells. Cells were labeled with tomato lectin. Scale bar, 20 µm. A representative photomicrograph from three different experiments is shown. Graph bars represent the mean number of latex beads phagocytosed by cells for each condition. The xyz axes projections obtained using confocal microscopy (lower panel) show that latex beads are internalized in the cytoplasm. Green channel and blue channel represent cell membranes and nuclei staining, respectively. Figure S2A,C in the Supplementary Material shows the panoramic images and fluorescence composition. (C) Electron microscopy images of microglia-derived EVs. Scale bar, 100 nm. Figure S2B in the Supplementary Material shows the panoramic images. (D) Measurement of the absolute size range and concentration of the EVs derived from microglia by the nanoparticles tracking analysis. (E,F) Analysis of the levels of the exosome protein markers CD81 and HSP70 (E) and the inflammatory-related proteins TLR4, NLRP3 and IL-1R (F) present in microglia-derived EVs upon 50 mM ethanol stimulation. A representative immunoblot for each protein and their molecular weight are shown. In each lane, 30 μg of protein were loaded. CD81 was used as the loading control. (G) Bar graphs represent the expression of the following miRNAs; miR-146a-5p, miR-21-5p and let-7b; after ethanol treatment (or no treatment) in BV2 microglial cells. Data represent mean ± SEM, n = 5 independent experiments. * p < 0.05, ** p < 0.01 and *** p < 0.001 compared to their respective control group according to the t-test. For the time-course experiments and nanoparticle tracking analysis, Kruskal–Wallis and One Way ANOVA analysis were used followed by Bonferroni post hoc test, respectively.

