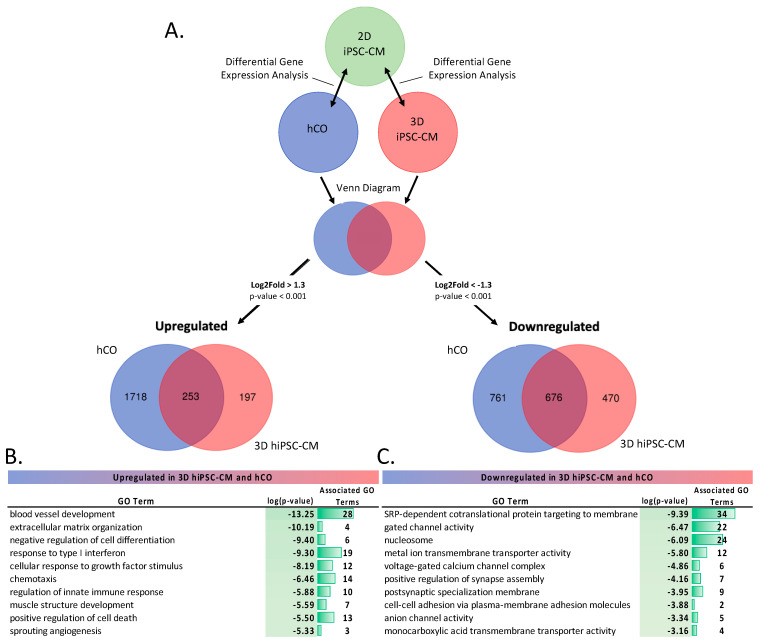
Figure 3.
DGE analysis of in vitro models (A) Schematic representation of the DGE analysis. DESeq2 was performed on hCOs (n = 3) and 3D hiPSC-CMs (n = 3) samples compared to 2D hiPSC-CMs (n = 3) samples. Results were filtered for DEGs with a |log2fold change| > 1.3 and p-value < 0.001. Differentially expressed genes were split into upregulated (log2fold change > 1.3) and downregulated (log2foldchange < −1.3). A Venn diagram of upregulated and downregulated genes was performed. (B,C) Pathway analysis of upregulated (B) and downregulated (C) differentially expressed genes expressed in both hCOs and 3D hiPSC-CMs.

