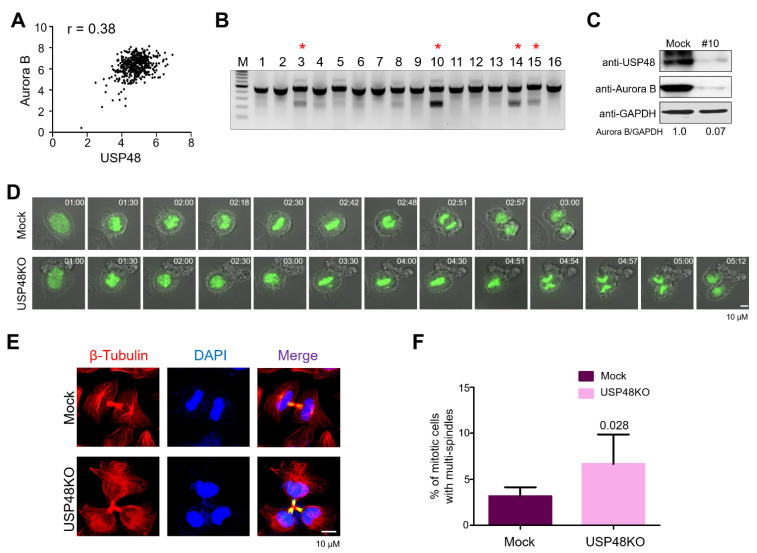
Figure 4.
USP48 influences cell cycle progression. (A) A scatterplot demonstrating the correlation between USP48 and Aurora B mRNA levels was plotted. Pearson correlation analysis (r) was used to quantify the relationship between USP48 and Aurora B (n = 455). (B) Single-cell-derived USP48KO colonies were screened using the T7E1 assay. Red asterisk represents the T7E1 positive USP48KO clones, i.e., USP48KO clones #3, #10, #14, and #15. (C) The effect of USP48 knockout on Aurora B protein expression was checked by Western blot analysis in USP48KO clone #10 upon M phase synchronization with 100 ng/mL Nocodazole for 18 h. GAPDH was used as a loading control. (D) Time-lapse microscopy of mock and USP48KO HeLa cells transfected with GFP-H2B and treated with thymidine and released into fresh medium to track cells undergoing mitosis. Time points are indicated in hh:mm format. Scale bar = 10 μM. (E) Microtubules were stained with β-Tubulin-Cy3 antibodies in mock and USP48KO HeLa cells. DAPI was used to stain the nuclei. Scale bar = 10 μM. (F) Graph representing the percentage of multinucleated cells in mock (3.166 ± 0.98), and USP48KO HeLa cells (6.667 ± 3.20) (n = 3, p = 0.028).

