Figure 2.
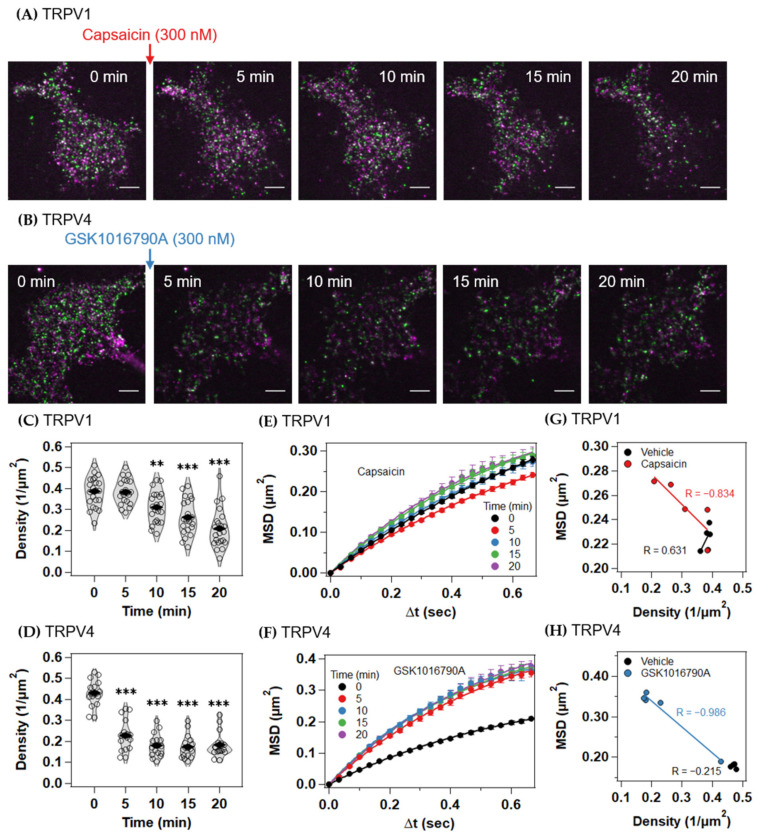
TIRFM image, receptor density, mean squared displacement (MSD)–Δt plots of TRPV1 and TRPV4 channels after activation. (A,B) Representative time-lapse TIRFM images of TRPV4-knockout (KO) HEK293 cell expressing JF549 (magenta)- and SF650 (green)-labeled TRPV1 after capsaicin (300 nM) stimulation (A); and TRPV4 after GSK1016790A (300 nM) stimulation (B). Scale bars, 5 µm. (C,D) Density of JF549-labeled TRPV1 (C) and JF549-labeled TRPV4 (D) after agonist stimulation. (E,F) MSD–Δt plots of the trajectories under the indicated ligand conditions. JF549-labeled TRPV1 (E), JF549-labeled TRPV4 (F). Data are means ± SEM of 17–22 cells. ** p < 0.01, *** p < 0.001 (one-way ANOVA followed by Dunnett’s multiple-comparisons test versus basal level). (G,H) Correlation between receptor density and time-averaged MSD at each time point for JF549-labeled TRPV1 (G) and JF549-labeled TRPV4 (H). Each circle represents a time point. Lines are regression lines, and R is Pearson’s correlation coefficient.

