Figure 3.
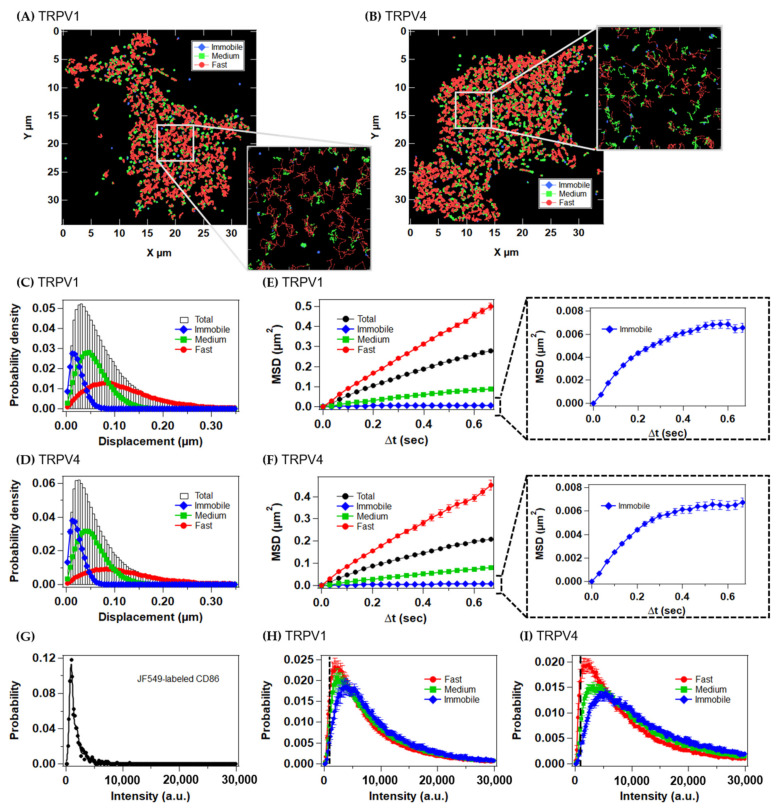
VB-HMM analysis of the trajectories of TRPV1 and TRPV4 molecules. (A,B) Each step in the trajectories was categorized into three diffusion states. The immobile, medium, and fast states are shown in blue, green, and red, respectively. (C,D) Histogram of the displacement of JF549-labeled TRPV1 (C) and TRPV4 (D) at the basal level. (E,F) MSD–Δt plots of each diffusion state of JF549-labeled TRPV1 (E), JF549-labeled TRPV4 (F). Data are means ± SEM of 17–22 cells. (G) Intensity histograms of JF549-labeled CD86 measured under the same conditions as described for TRPV1 and TRPV4. (H,I) Histogram of the intensity of JF549-labeled TRPV1 (H) and JF549-labeled TRPV4 (I) at the basal level. Dashed line represents the intensity of single molecules (896 a.u.) estimated from JF549-labeled CD86 (the monomeric control).

