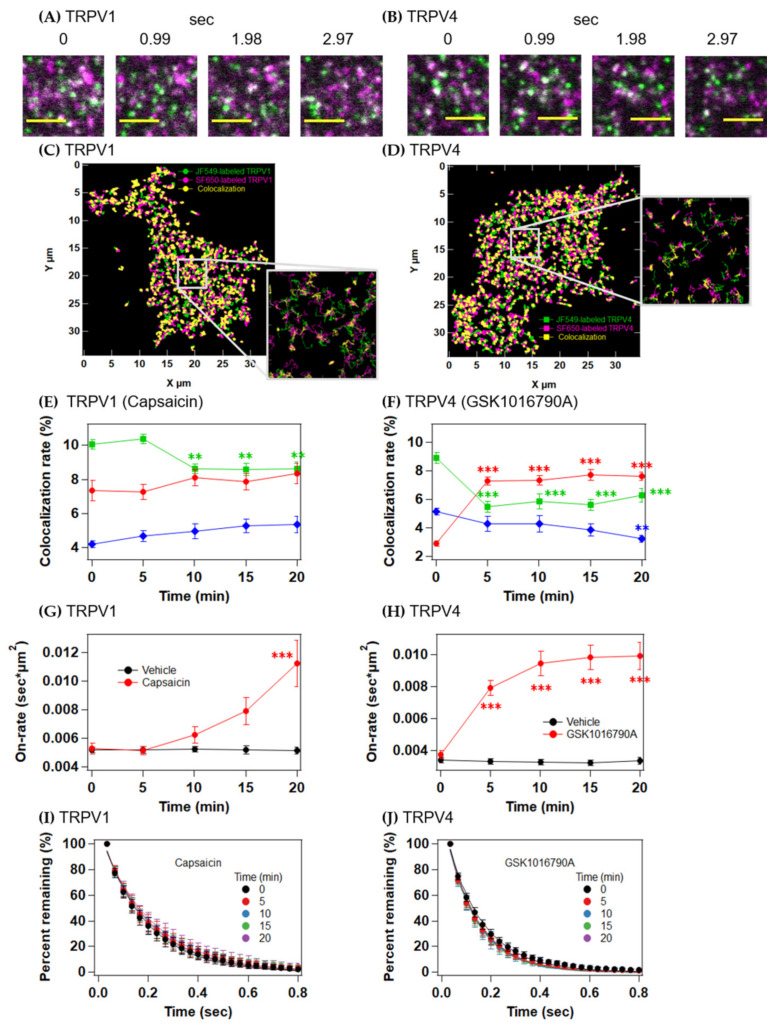
Figure 5.
Colocalization analysis of TRPV1 and TRPV4 upon activation. (A,B) Representative images of the colocalization of JF549-labeled TRPV1 (green) and SF650-labeled TRPV1 (magenta) (A) and JF549-labeled TRPV4 (green) and SF650-labeled TRPV4 (magenta) (B). Colocalized bright spots appear to be white. Scale bars, 3 µm. (C,D) Trajectories of colocalized TRPV1 molecules (C) and TRPV4 molecules (D). (E,F) Time-dependent changes in the colocalized fractions of the diffusion states. TRPV1 after capsaicin stimulation (E), TRPV4 after GSK1016790A stimulation (F). (G,H) On-rate constants of JF549-labeled TRPV1 (G) and JF549-labeled TRPV4 (H) after stimulation with vehicle (black) or agonist (red). (I,J) Time-dependent changes in the percentage of TRPV1 remaining (I) and TRPV4 remaining (J) upon activation. Data are means ± SEM of 17–22 cells. ** p < 0.01, *** p < 0.001 (one-way ANOVA followed by Dunnett’s multiple-comparisons test versus the basal level (0 min)).

