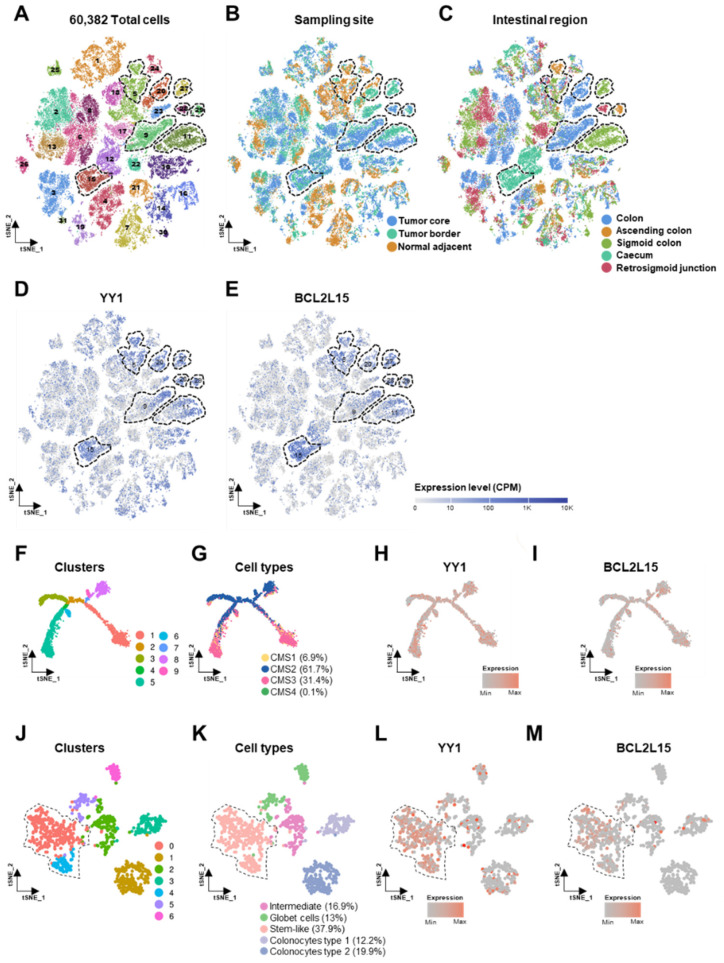
Figure 7.
Correlation of YY1 and BCL2L15 expression with single-CRC-cells features in GSE132465 and GSE144735 datasets. (A) t-distributed stochastic neighbor embedding (t-SNE) plot of 60,382 CRC total cells (clusters). (B) t-SNE plot of CRC total cells (sampling site). (C) t-SNE plot of CRC total cells (intestinal region). (D) t-SNE plot of CRC total cells (YY1 expression). (E) t-SNE plot of CRC total cells (BCL2L15 expression). Expression level as counts per million reads mapped (CPM). (F) t-SNE plot of 17,469 tumor epithelial cells (clusters). (G) t-SNE plot of tumor epithelial cells (CMS signatures). (H) t-SNE plot of tumor epithelial cells (YY1 expression). (I) t-SNE plot of tumor epithelial cells (BCL2L15 expression). (J) t-SNE plot of 1070 normal epithelial cells (clusters). (K) t-SNE plot of normal epithelial cells (cell types). (L) t-SNE plot of normal epithelial cells (YY1 expression). (M) t-SNE plot of normal epithelial cells (BCL2L15 expression). Dotted lines highlight areas of YY1 and BCL2L15 high expression.

