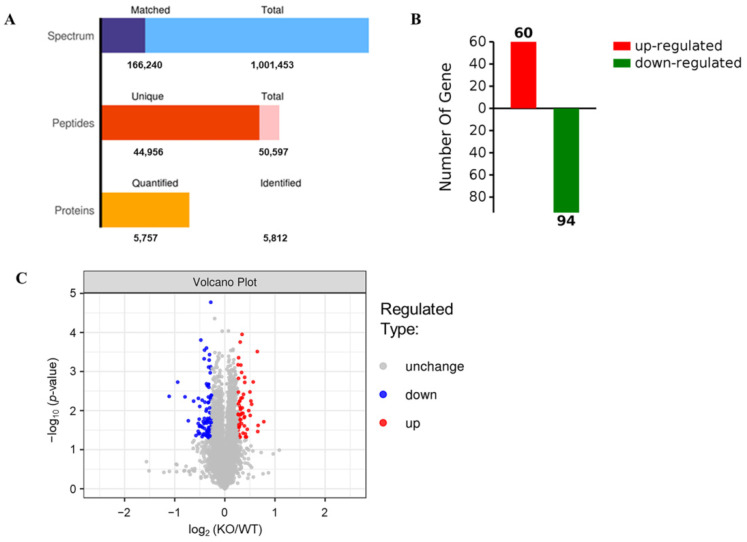
Figure 4.
Differential expression of proteins detected by TMT in the livers of Selenot-KO and WT mice. (A) Numbers of spectrum, peptides and proteins. Total spectrum: the total number of secondary spectrograms; Matched spectrum: the total number of spectra matched the database. (B) Numbers of significantly up-regulated or down-regulated proteins in the livers of KO mice in comparison to WT mice. A protein was identified as significantly changed protein in the liver of KO mice if the FC was >1.2 (down < 0.83 times or up > 1.2 times), and the p-value was <0.05 compared with WT mice. (C) The volcano plots (log2 (KO/WT) vs. −log10 (p-value)).

