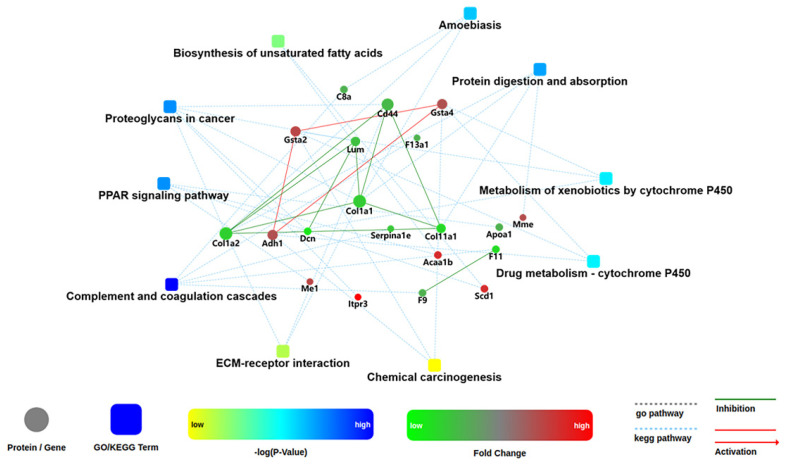
Figure 11.
Network analysis of enriched pathways and interactions. Pathways were colored with a gradient color from yellow to blue; yellow for a smaller p-value, blue for bigger p-value. In case of fold change analysis, genes/proteins were colored in red (up-regulation) and green (down-regulation). The default confidence cutoff of 400 was used: interactions with bigger confident score were shown as solid lines between genes/proteins, otherwise in dashed lines.

