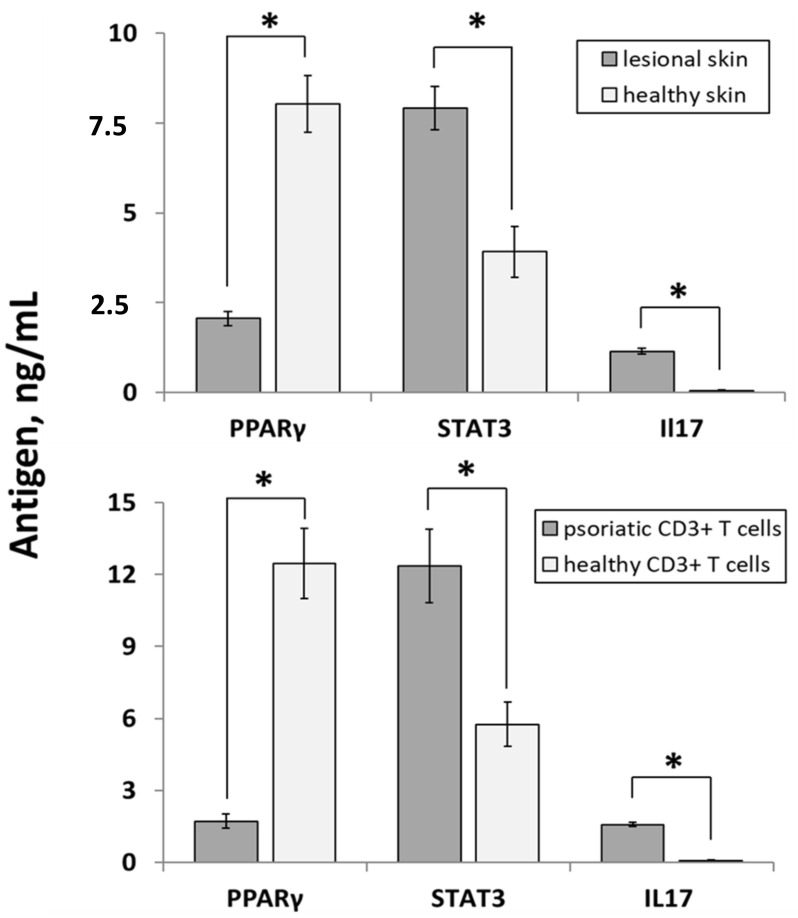
Figure 3.
The expression levels of selected proteins in the samples obtained from psoriasis patients (n = 23) and healthy volunteers (n = 10) assessed by ELISA. The upper panel—lesional vs. healthy skin. The lower panel—samples of CD3+ T cells of psoriasis patients and healthy volunteers. Statistically significant changes in gene expression (p < 0.05) are marked with asterisk sign (*).

