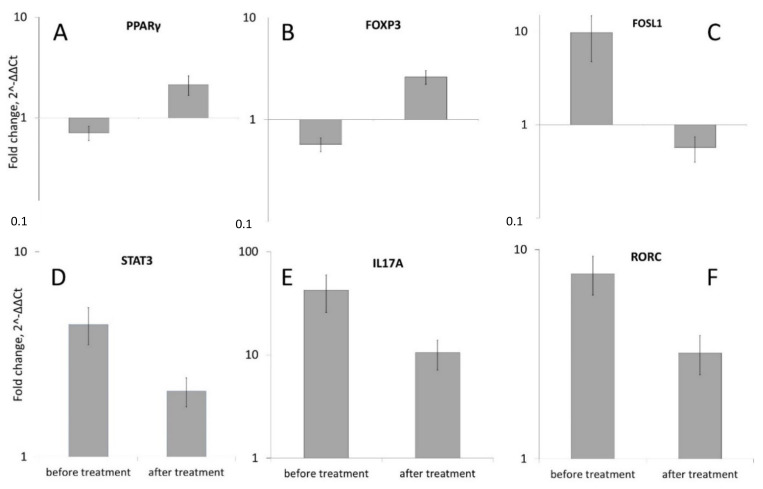
Figure 6.
Comparison of PPARγ (A), FOXP3 (B), FOSL1 (C), STAT3 (D), IL17A (E) and RORC (F) genes expression in the skin of 23 patients with psoriasis before and after low-level laser therapy. The levels of mRNA concentration for genes in psoriatic skin samples was calculated in relation to the level of the same genes in unaffected skin samples (which was taken as conditional 1, p < 0.05). See supplemental materials for detailed statistics (“PPARG expression file”).

