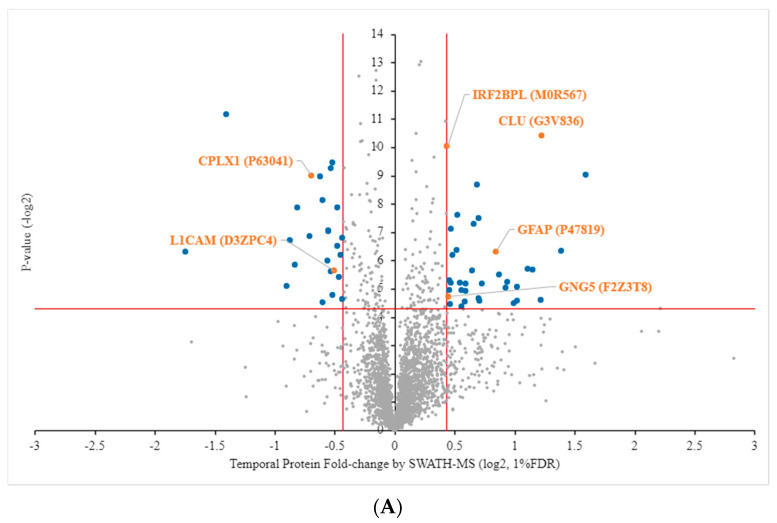
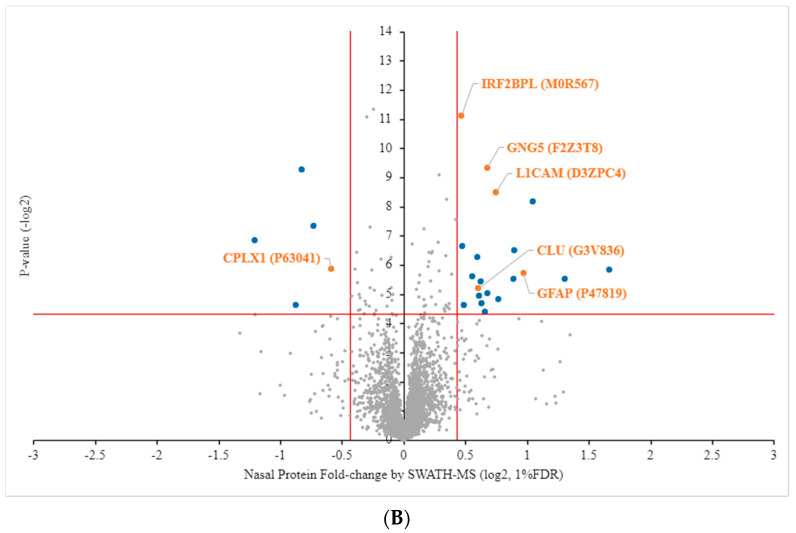
Figure 3.
Volcano plot of proteins quantified using SWATH-MS. A plot of protein fold-change (log2, x-axis) and p-values (-log2, y-axis). Significantly differentiated unique proteins in quadrant positions (blue) and shared proteins (orange) were determined by p-values < 0.05, fold-change log2 > 0.43 (up-regulation) or ≤ −0.43 (down-regulation) and a 1% false discovery rate (FDR). (A) Left temporal (LT) compared to right temporal (RT). (B) Left nasal (LN) compared to right nasal (RN). Names of shared proteins are shown.


