Figure 1.
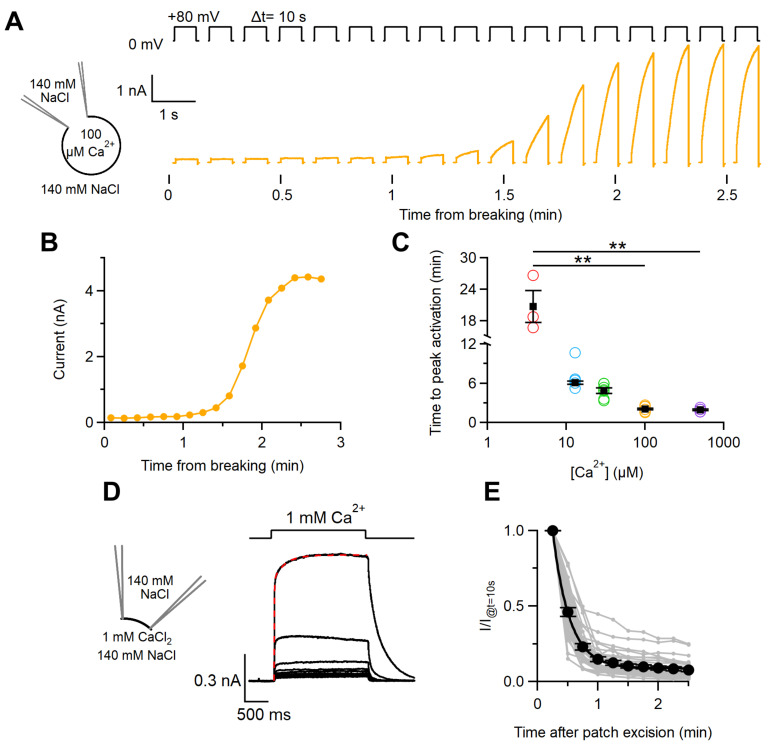
Kinetics of Ca2+-dependent activation of the TMEM16F wt-mediated current. (A) Whole-cell recordings obtained from TMEM16F wt-transfected cells with a pipette solution containing 100 μM Ca2+. The development of the current with time was monitored by repeatedly applying a +80 mV step every 10 s, as indicated in the upper traces. (B) Current amplitudes at the end of voltage steps were plotted against the time after membrane breaking for the recordings in (A). (C) The time required to obtain the maximal current activation was plotted against the intracellular Ca2+ concentration (n = 3–8, ** p < 0.01 Dunn–Holland–Wolf test after Kruskal–Wallis test). (D) An inside-out excised membrane patch expressing TMEM16F wt was repeatedly stimulated every 15 s with a solution containing 1 mM Ca2+ as indicated in the upper trace. The holding potential was +60 mV. The red line superimposed to the upper trace is the fit with a double exponential function. (E) Ratios between the peak current values measured at various times after patch excision and the value measured after 10 s were plotted against the time after patch excision for several patches (grey dots and lines). Black circles are the average ± sem from different patches (n = 31). The black line is the best fit to a single exponential.

