Figure 2.
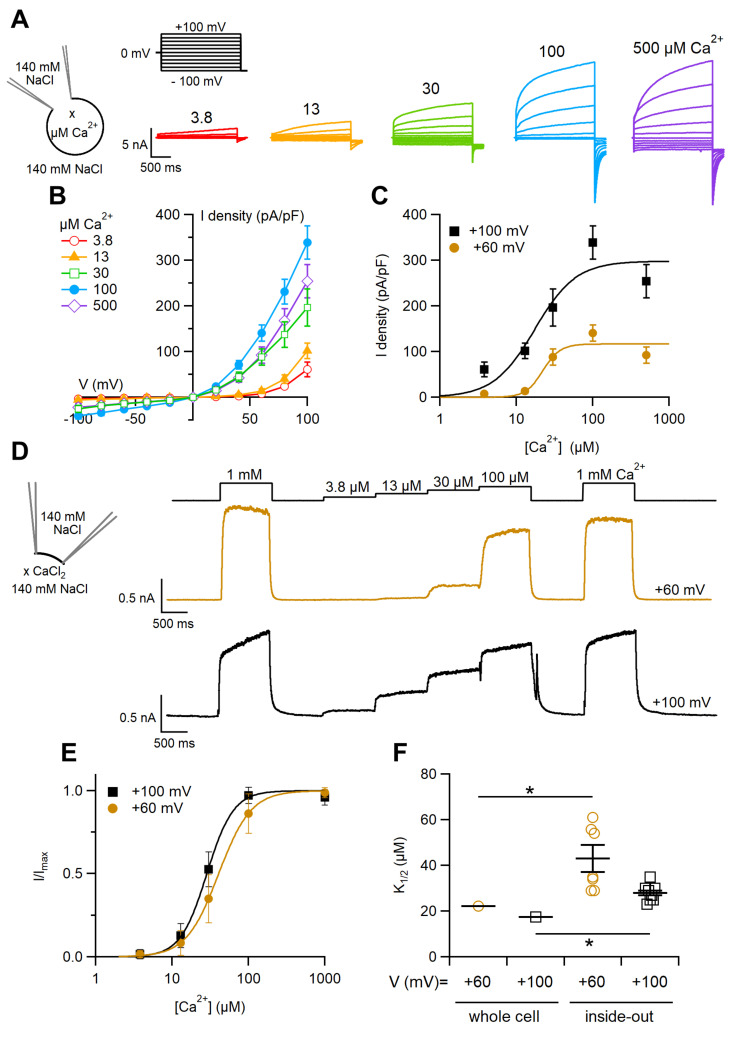
Ca2+ sensitivity of the TMEM16F wt-mediated current. (A) Representative whole-cell currents recorded from TMEM16F wt-expressing cells with a pipette solution containing the indicated intracellular Ca2+ concentrations (x). The voltage protocol is shown at the top of the panel. (B) Average steady-state IV relationships from several cells at the indicated Ca2+ concentrations (n = 4–10). (C) Averages ± sem of the current density at different voltages were plotted against Ca2+ concentration (n = 4–10). The continuous lines are the fit with the Hill equation. (D) An inside-out excised membrane patch expressing TMEM16F wt was kept in 0 Ca2+ and exposed for 1 s to solutions containing different free Ca2+ concentrations (x) at the time indicated in the upper traces. The holding potential was +60 mV, or +100 mV as indicated. (E) Dose–response relations of activation by Ca2+ obtained by normalised currents and fitted to the Hill equation. Current amplitudes were calculated as the average value in the last 50 ms to each Ca2+ exposure and the current amplitude in 0 Ca2+ was subtracted. (F) Comparison of K1/2 obtained in different recording configurations (n = 7–8 for inside out, * p < 0.05).

