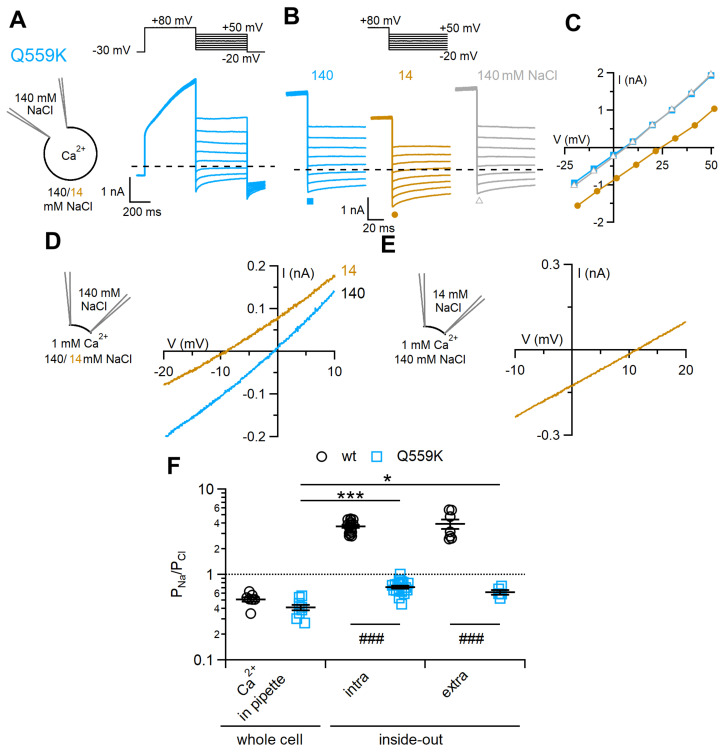
Figure 6.
Q559K ion permeability ratio PNa/PCl depends on the recording configuration. (A,B) Representative whole-cell voltage-clamp recordings obtained from TMEM16F Q559K mutant-transfected cells with intracellular solution containing 300 μM Ca2+. Voltage protocols are shown at the top of the panels. (B) A cell was exposed to a control solution containing 140 mM NaCl, then to 14 mM NaCl, followed by wash out with 140 mM NaCl. (C) IV relations measured from tail currents of the cell shown on the left with 140 mM NaCl (squares), 14 mM NaCl (circles) and after wash out (triangles). (D,E) Inside-out patches expressing TMEM16F were exposed to the indicated NaCl concentrations, and the IV relations were determined by voltage ramps from +100 to −80 mV. Only the regions around the reversal potentials are shown. Currents were activated by 1 mM CaCl2 and leakage currents measured in 0 Ca2+ were subtracted. The pipette solution contained 140 mM NaCl (C) or 14 mM NaCl (D). (F) Comparison of PNa/PCl in different recording conditions for Q559K and wt (n = 5–19; *** p < 0.001, * p < 0.05 Tukey test after ANOVA, F = 18.271, p = 8.36 × 10⁻⁶; ### p < 0.001, unpaired t-test).

