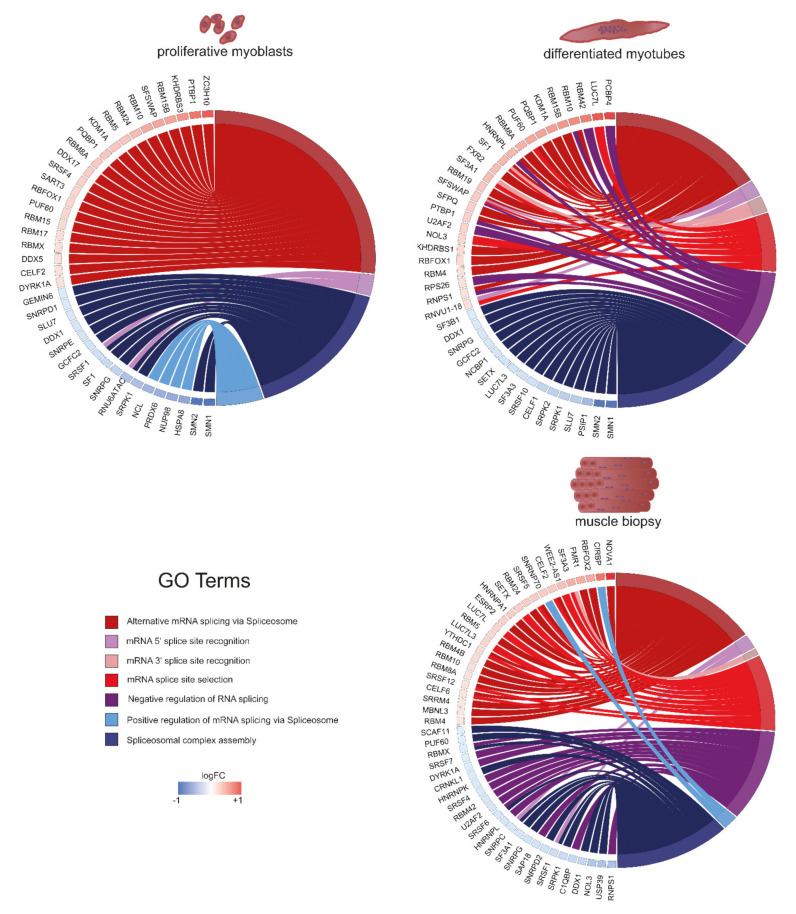
Figure 5.
Graphs showing differences in expression between DM1 and non-disease controls for genes linked to splicing in proliferating myoblasts (upper left), differentiated myotubes (upper right), and muscle biopsies (lower right), sequencing data published by [57]. The colour of the boxes next to the gene name shows the level of expression change compared to controls. Genes are grouped depending on their GO-term.

