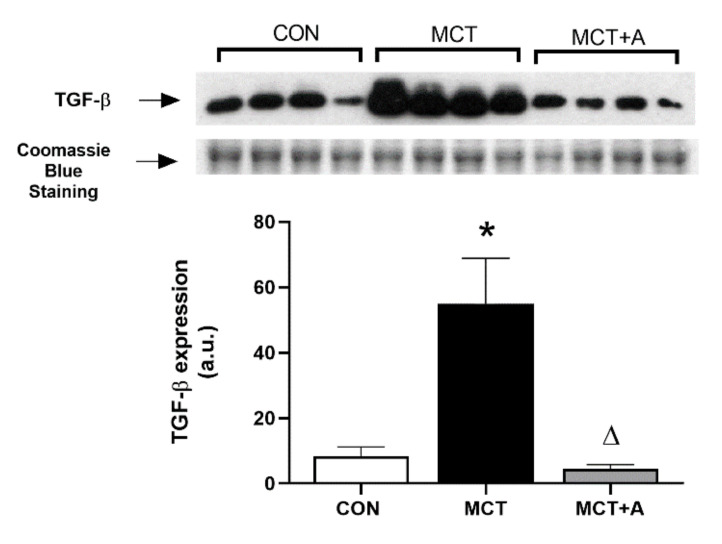
Figure 9.
Effect of allicin on TGF-β levels in the RVs of MCT-induced PAH rats. Control group (CON), saline solution as the vehicle; monocrotaline group (MCT) with 60 mg/kg; and MCT with 16 mg/kg of allicin (MCT + A). For Western blotting, four randomly selected samples per group were analyzed. Differences were tested by ordinary one-way ANOVA followed by the Tukey multiple comparison test. Data are presented as mean and standard errors. * p < 0.05 vs. Control; ∆ p < 0.05 vs. MCT.

