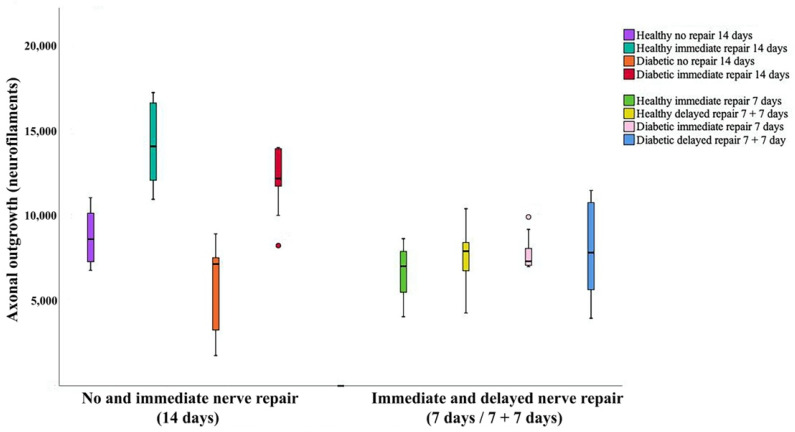
Figure 4.
Boxplot of axonal outgrowth (i.e., neurofilament, μm) from the models (i.e., no repair and immediate nerve repair—14-day follow-up, left; immediate and delayed—7 days—nerve repair—7-day follow-up, right) in both healthy Wistar and diabetic GK rats. The box plots represent median values (horizontal line in the middle) and 25th and 75th percentiles (Tukey’s hinge). Error bars show min-max values.

