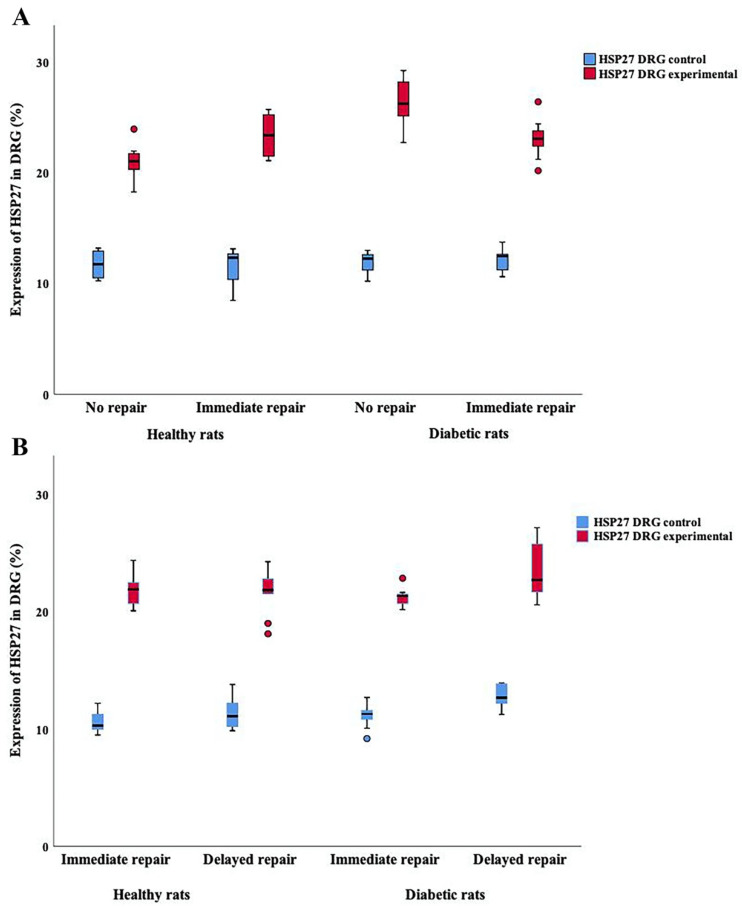
Figure 10.
Boxplots demonstrating HSP27 expression from control and experimental sides in the dorsal root ganglion (DRG). (A) shows the HSP27 expression after no and immediate nerve repair with 14-day follow-up compared to the contralateral side both in healthy Wistar and in diabetic GK rats. (B) shows the HSP27 expression after immediate and delayed (7 days) nerve repair with 7-day follow-up compared to the contralateral side in healthy Wistar and in diabetic GK rats. The box plots represent median values (horizontal line in the middle) and 25th and 75th percentiles (Tukey’s hinge). Error bars show min-max values.

